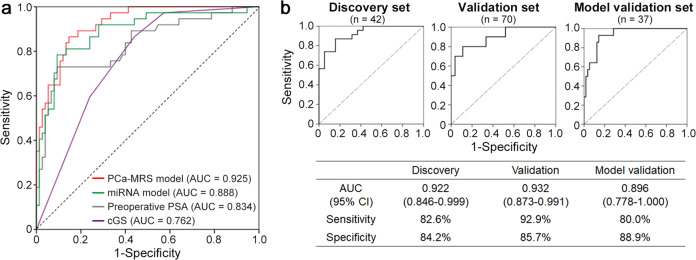
Fig. 1. Performance of the risk prediction model.
a Receiver operating characteristic (ROC) curves for the risk prediction model (PCa-MRS) comprising three miRNAs (miR-636, miR-21, and miR-451) with preoperative PSA level (red). The model showed superior stratification power (AUC = 0.925) to other models composed of either miRNAs (green), preoperative PSA level (gray), or clinical Gleason score (purple) only. b ROC curves for PCa-MRS of each sample set. Sensitivity and specificity were calculated based on a cutoff value of −0.82 in the PCa-MRS model from Youden’s index. PSA prostate-specific antigen, AUC area under the curve, cGS clinical Gleason score.

