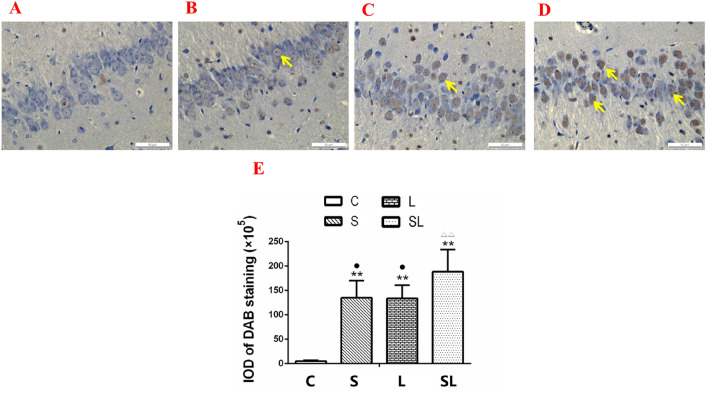
Figure 4.
Cell apoptosis in the hippocampus of rats 6 h after 2.856 GHz and 1.5 GHz microwave exposures, as detected by TUNEL staining. (A–D) Hippocampi of the C group, S group, L group and SL group (TUNEL, scale bar = 50 μm). (E) IOD changes in the hippocampus. Compared to the C group, **p < 0.01. Compared to the cumulative group, •p < 0.05. ΔΔp < 0.01 indicates the existence of interaction effects between the 2.856 GHz and 1.5 GHz microwaves. “C” stands for the control group, “S” stands for the 2.856 GHz microwave exposure group, “L” stands for the 1.5 GHz microwave exposure group, and “SL” stands for the 2.856 and 1.5 GHz cumulative exposure group. The data are presented as the means ± SDs.

