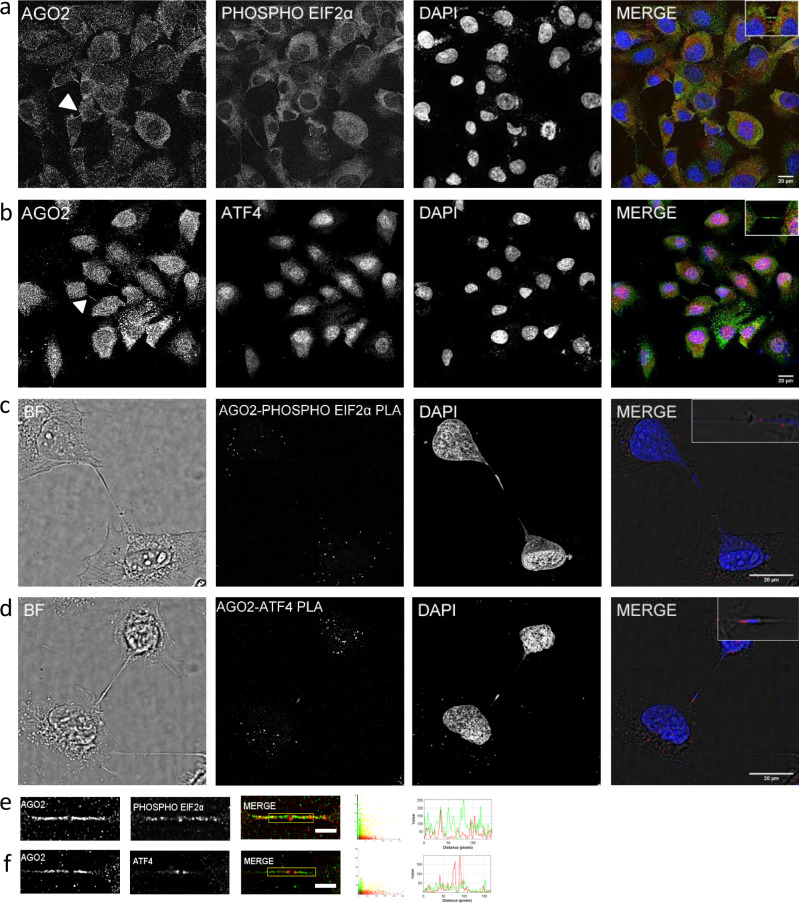
Fig. 10. Subcellular localization and interaction between AGO2 and ER-stress regulators.
Representative images of NTHY ori 3-1 cells showing AGO2 colocalization with a phospho-Elf2α and b ATF4. AGO2 proteins in green, phospho-EIf2α and ATF4 in red. Nuclei of cells were visualized in blue (DAPI). iPLA foci between c AGO2-phospho-EIf2α and d AGO2-ATF4 in red. e–f Visual assessment (merged images, scatterplots, and intensity lineplots) of colocalization. Lineplots indicate the signal intensity of the paired proteins along the lines overlaid on the corresponding images that appear in Supplementary Fig. S2e–f. Scale bar: 20 μm (full images), 5 μm (zoomed images).

