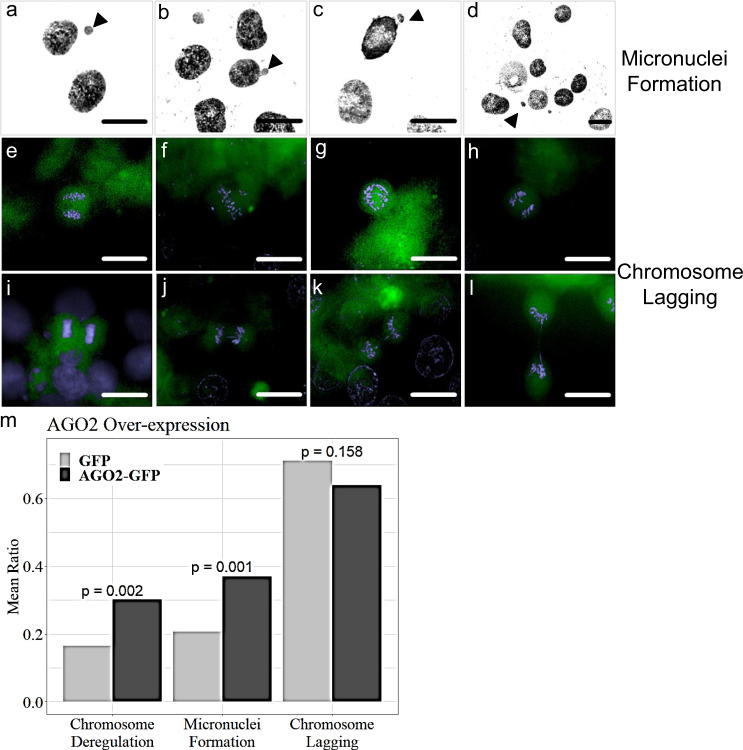
Fig. 7. AGO2 over-expression leads to numerical chromosomal instability and micronuclei formation.
a–d Representative images of HCT116 AGO2-GFP transfected cells depicting a, c, d micronuclei formations and b bleb nuclei, as indicated by the black arrowheads. e, i normal anaphase and cytokinesis. AGO2-GFP transfected cells carry f abnormal metaphase congression, g anaphase or j cytokinetic chromosomal bridges, and h lagging chromosomes in telophase or k, l in cytokinesis. GFP expression in green and nuclei in blue (DAPI) (scale bar: 10 μm). m Bar plot of the effects of AGO2 over-expression on numerical chromosome deregulation, micronuclei formation, and lagging chromosomes. z-test was used to evaluate their significance. Bar height indicates the ratio of deregulated chromosomes (n = 3 biologically independent experiments, statistical sample size n1 = 188 GFP cells, n2 = 182 AGO2-GFP cells), cells with micronuclei formation (n = 3 biologically independent experiments, statistical sample size n1 = 174 GFP cells, n2 = 168 AGO2-GFP cells), and with lagging chromosomes (n = 3 biologically independent experiments, statistical sample size n1 = 176 GFP cells, n2 = 169 AGO2-GFP cells), respectively.

