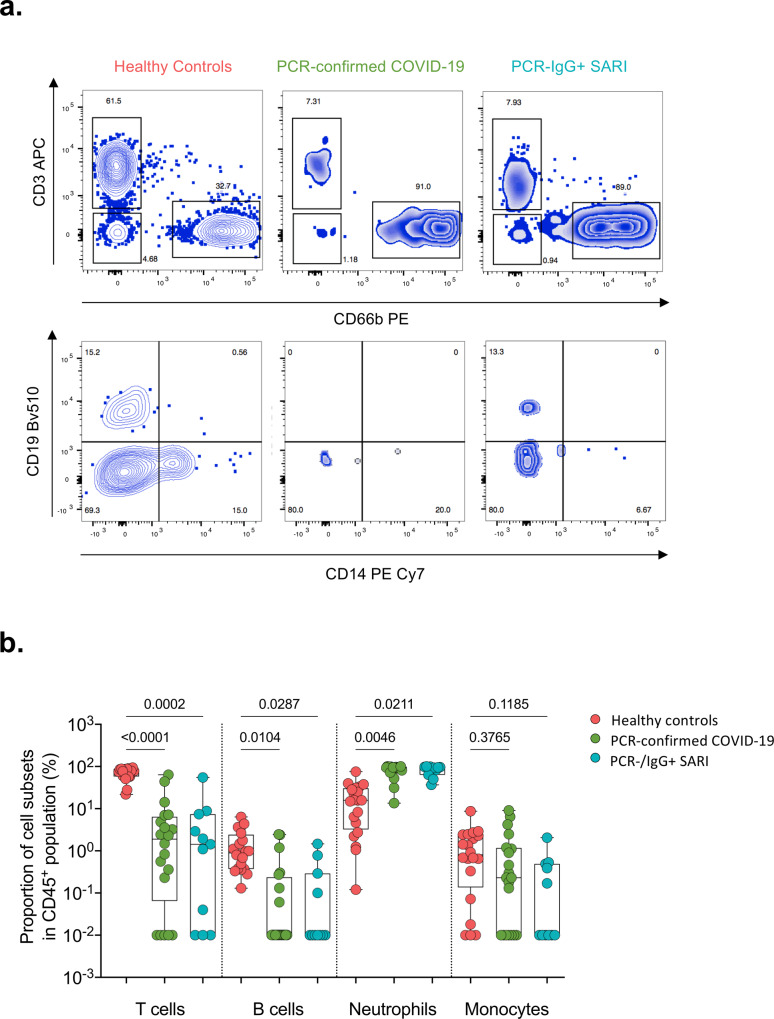
Fig. 4. Nasal cell composition in healthy controls, confirmed and suspected COVID-19 patients.
a Representative flow cytometry plots for cellular composition in the nasal mucosa of healthy controls, PCR-confirmed COVID-19 and PCR−/IgG+ SARI patients. b Proportions of T cells, B cells, neutrophils and monocytes in nasal mucosa of healthy controls and COVID-19 patients. For all boxplots, box boundaries correspond to 25th and 75th percentiles; whiskers extend to a maximum or minimum greatest value. Data were analysed using Kruskal–Wallis test, two-sided (healthy controls, n = 20; PCR-confirmed COVID-19, n = 20; PCR−/IgG+ SARI, n = 11). SARS-CoV-2 severe acute respiratory syndrome coronavirus 2, COVID-19 coronavirus disease of 2019, PCR polymerase chain reaction, IgG immunoglobulin G, SARI severe acute respiratory infection. Source data are provided as a Source Data file.

