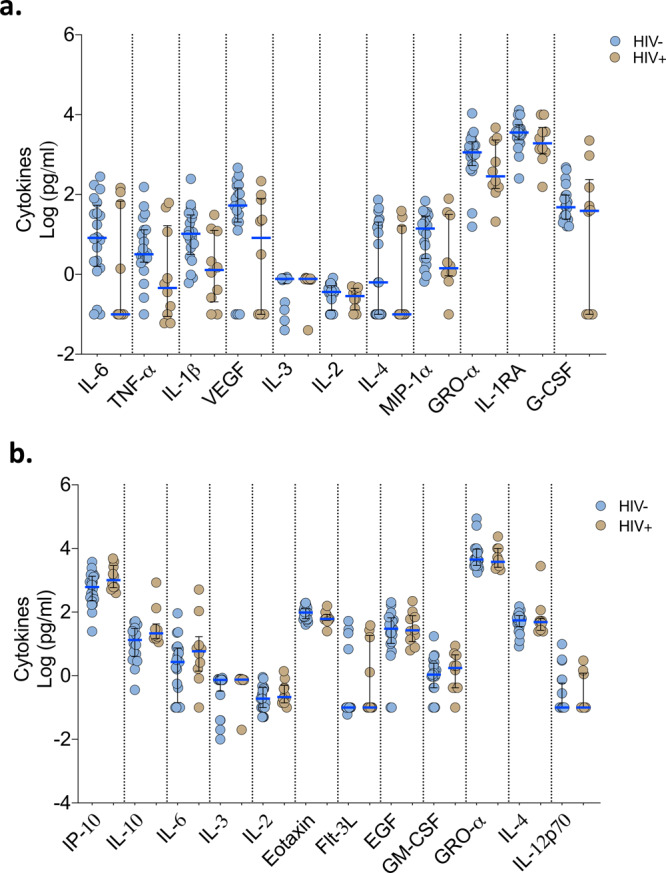
Fig. 6. Cytokine concentrations in nasal lining fluid and serum based on HIV-co-infection status.

PCR-confirmed COVID-19 and PCR−/IgG+ SARI patients were combined (n = 41) into one COVID-19 patient group. Only cytokines that showed differential responses between patients with healthy controls were included in the analysis. a Cytokine concentrations between HIV-infected and uninfected COVID-19 patients in nasal lining fluid. b Cytokine concentrations between HIV-infected and uninfected COVID-19 patients in serum. The horizontal bars represent the median (blue line) and interquartile range (IQR) (black lines). Data were analysed using Kruskal–Wallis test (HIV−, n = 20; HIV+, n = 10). COVID-19 coronavirus disease of 2019, PCR polymerase chain reaction, SARI severe acute respiratory infection. Source data are provided as a Source Data file.
