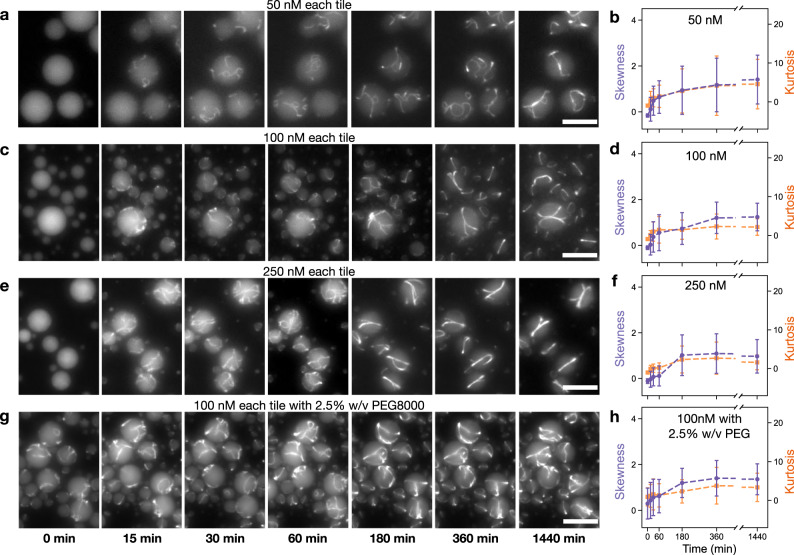
Fig. 3. Isothermal assembly of encapsulated two-tile DNA nanotubes at room temperature.
Tiles were pre-annealed and mixed immediately before encapsulation. a, c, e Representative temporal sequence of fluorescence microscopy images of two-tile nanotubes encapsulated at 50, 100, and 250 nM concentration for each tile. b, d, f Plots of the mean skewness (purple) and kurtosis (orange). g Representative images of two-tile nanotubes encapsulated at 100 nM each tile, with 2.5% w/v PEG. h Plot of the mean skewness (purple) and kurtosis (orange) over time for isothermal assembly of tiles encapsulated with PEG. Data were presented as mean values ± standard deviation. Data extracted using droplet detection code as described in Supplementary Note S4.13. Number of droplets sampled and histogram data of radii for sampled droplets in Supplementary Notes S5.9 and S5.10. Source data for this figure is provided as a source data file. Scale bars: 20 μm.

