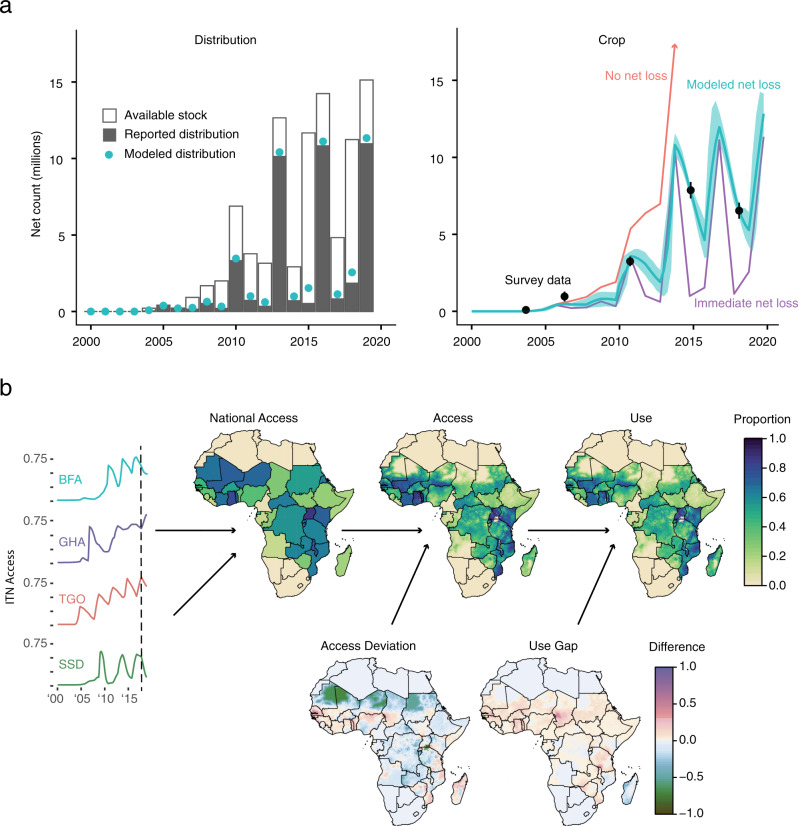
Fig. 1. Insecticide-treated net (ITN) model summaries.
a Mechanistic “stock-and-flow” model. For each country (Burkina Faso shown for reference), the number of nets distributed must be no less than the reported distribution count and no more than the available stock (solid bars, left). Net loss follows an S-shaped curve whose steepness is fitted according to survey data (right). If nets were never discarded, net crop would increase cumulatively with every distribution (red line), whereas if nets were discarded immediately, net crop would equal net distribution (purple line). The fitted curve (blue line and 95% confidence interval) balances these two extremes. b Geostatistical regression model. After net crop time series are converted to net access time series, geospatial regression models are run on the difference metrics of “access deviation” and “use gap.” Final maps of ITN access are calculated by adding national access and access deviation, while final maps of ITN use are calculated by adding access and use gap. Maps of nets-per-capita are calculated similarly to access. BFA Burkina Faso, GHA Ghana, TGO Togo, SSD South Sudan. These four access time series are shown as examples, but 40 countries are included in the analysis.

