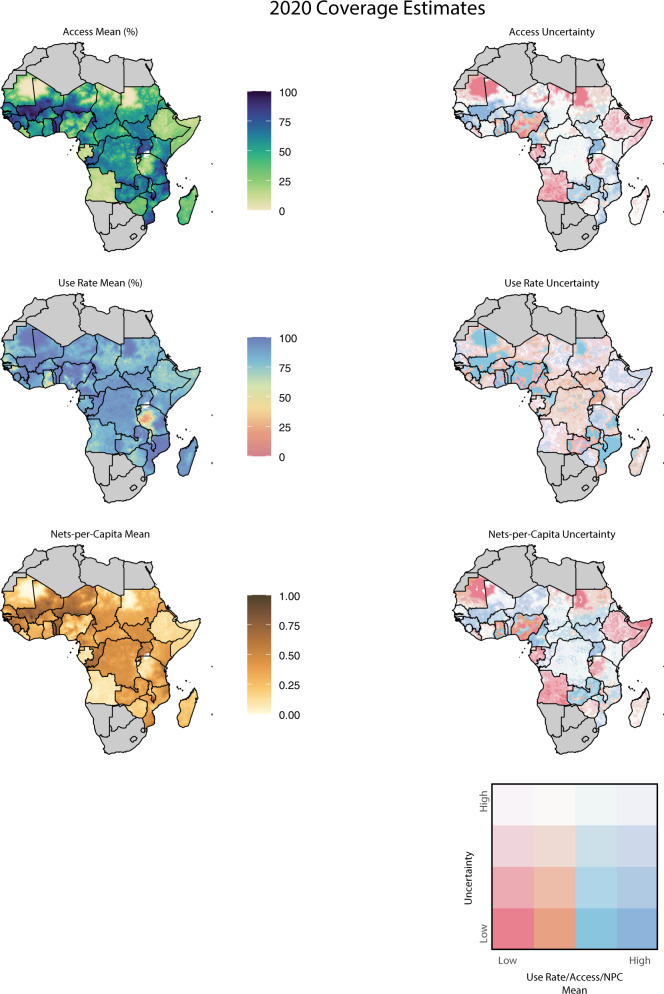
Fig. 3. Maps of insecticide-treated net access, use rate, and nets-per-capita (NPC) in 2020, with associated uncertainty.
Access is defined as the proportion of the population that could sleep under a net, assuming one net per two people. The use rate is defined as use among those with access. The uncertainty maps use a bivariate scale to convey information about both mean estimates and magnitude of uncertainty. Quantiles of 95% confidence interval width are represented by saturation level, with the most uncertain values having the lowest saturation. Quantiles of mean values are represented by hue, with low values in pink and high values in dark blue. For example, access estimates are most uncertain in the Democratic Republic of the Congo and Zimbabwe in 2020, but there is considerable certainty that much of northern Mozambique is in the third quartile of use rate.

