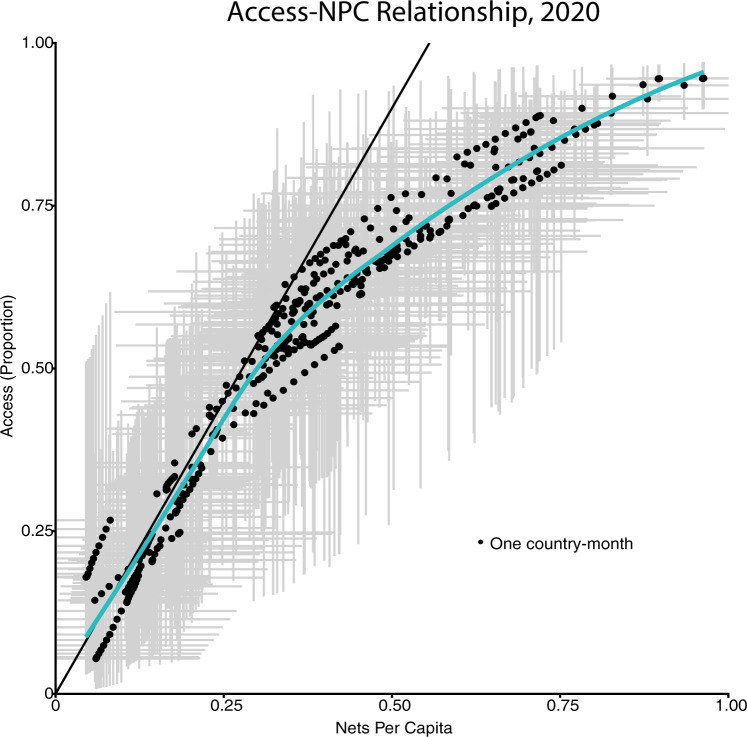
Fig. 4. Relationship between access and nets-per-capita (NPC) in 2020.
Each dot represents a modeled country-month, with black dots indicating mean values and gray bars indicating 95% confidence intervals for each metric. The solid line has a slope of 1.8, showing the relationship between NPC and access presumed by population-based net procurement decisions. The blue curve shows a Loess fit through the estimated points. The expected linear relationship between NPC and access holds well at low coverage levels, but the true relationship tapers off at NPC values greater than 0.25 and access over 0.5. This plateauing of access despite high numbers of nets distributed per capita suggests inefficiencies or redundancies in net distribution at these coverage levels, such that those who should be receiving nets are still left without access.

