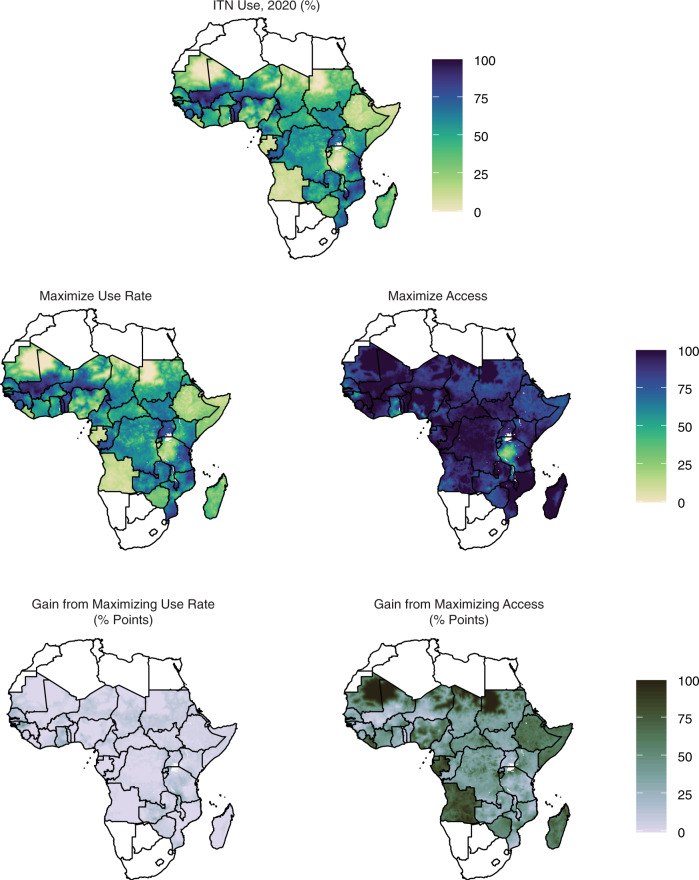
Fig. 6. Magnitude of change in insecticide-treated net (ITN) use possible from increasing use rate versus increasing access.
The top row shows estimated ITN use in 2020. The second row shows what use could be if access remained unchanged and the use rate were set to 100% (left), compared to if the use rate remained unchanged and access was set to 100% (right). The final row shows the magnitude gain in use from each of these two scenarios. With few exceptions, increasing access has a larger impact than increasing the use rate.

