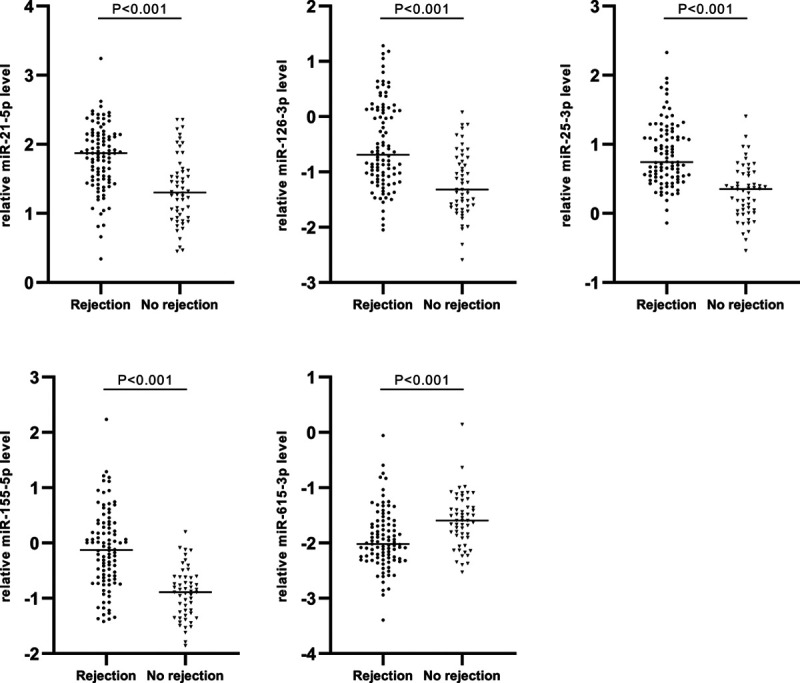
FIGURE 2.

Differentially expressed miRNAs between rejection (n = 98) and no-rejection (n = 54) urine sediments. Scatter plots of relative miR expression levels are shown on a logarithmic scale. Medians are presented by horizontal lines. Differences were tested by Mann–Whitney U tests. miR, microRNA.
