
FIGURE 4.
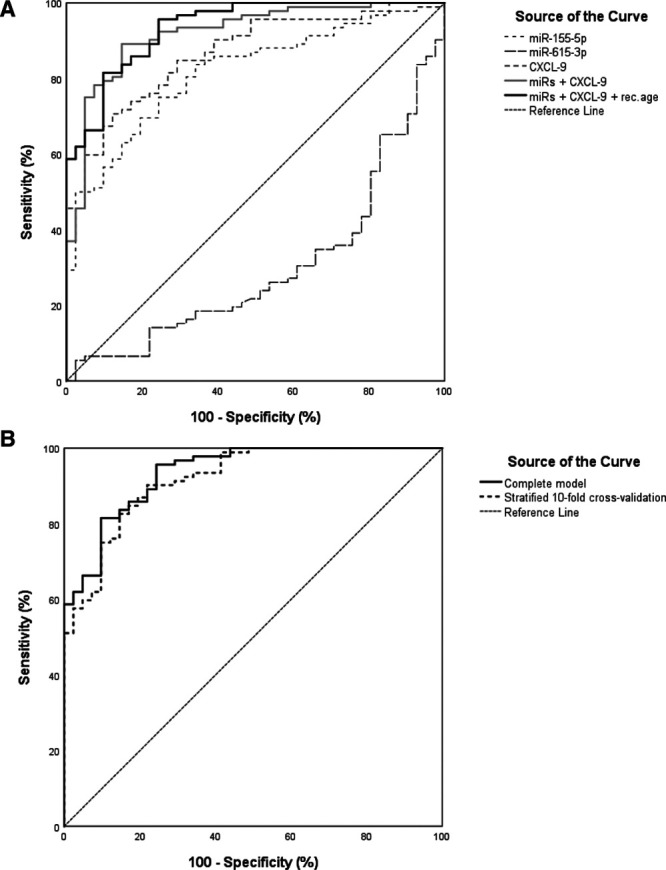
Receiver operating characteristic (ROC) curves of markers and combined models for distinction of rejection. A, ROC curves are shown for each individual miR and for CXCL-9, which were independent predictors in the combined miR/CXCL-9 model (gray line) and the combined miR/CXCL-9/recipient age model (black line). B, ROC curves for the complete model (dashed line) from (A) and for the stratified 10-fold cross validated model (solid line). The following group sizes (rejection/no rejection) applied to the ROC curves; for the miRs: 98/54, for CXCL-9: 108/43, and for the models: 92/41. miR, microRNA.