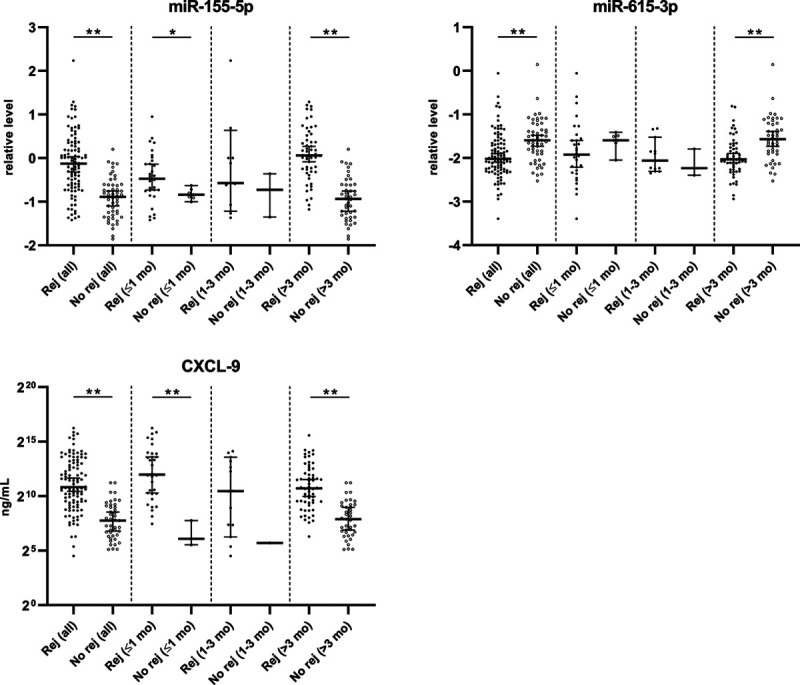
FIGURE 6.

MiR- and CXCL-9 levels in the rejection and no-rejection groups, according to timing after transplantation (≤1; 1–3; >3 mo). Medians with 95% confidence interval are shown. Rej: rejection group, No rej: no-rejection group. *P < 0.05. **P < 0.005. The 1- to 3-mo category was not tested for statistical difference between groups because of low sample size in the no-rejection group. miR, microRNA.
