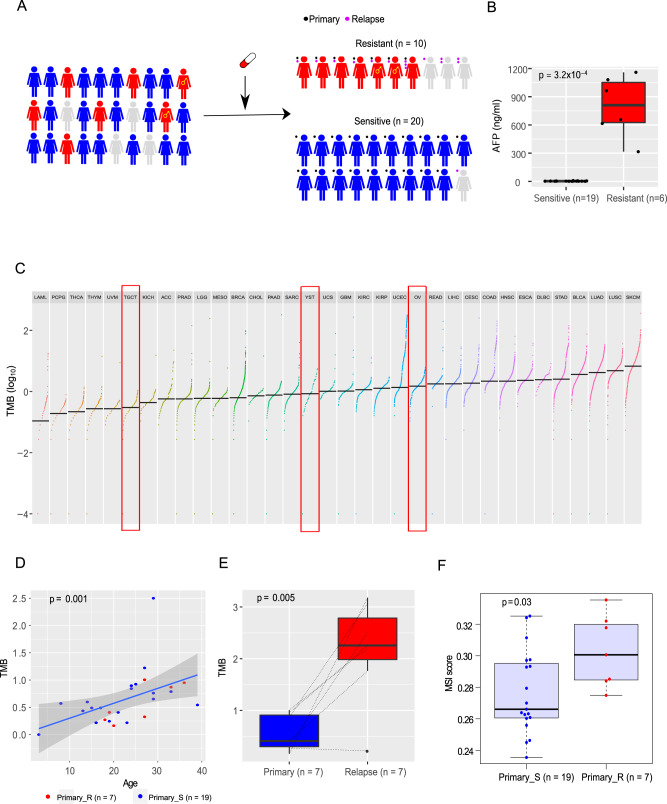
Fig. 1. The overview study design and tumor mutation burden of YSTs.
A Study design. This study includes 41 YST samples from 30 patients. Based on the response to chemotherapy, patients were classified into chemo-resistant (n = 10) and chemo-sensitive groups (n = 20). Of note, two YST patients with 46 XY pure gonadal dysgenesis are marked with the male symbol. Primary and relapsed tumor samples are labeled as black and purple dots, respectively. B The AFP level comparison of chemo-sensitive and -resistant patients whose primary tumors were sequenced six months after initial treatment. Two-sided Wilcoxon rank sum test was used to compute the p value (sensitive: n = 19 biologically independent samples; resistant: n = 6). C The TMB distribution of YSTs in the context of 33 TCGA cancer types. YST and two related cancer types, OV and TGCT, are highlighted in red boxes. D The correlation between TMB and age at diagnosis in YSTs. The blue line and the shaded area represent the regression line and the related 95% confidence interval, respectively. Spearman rank correlation between age and TMB is shown. E The TMB difference between matched primary and relapsed tumor samples. The dotted lines indicate the matched sample pairs. For patients with multiple relapse samples, the mean TMB values were used. Two-sided t-test was used to compute the p value (n = 7 samples). F The microsatellite instability (MSI) scores between resistant and sensitive primary tumors. Two-sided Wilcoxon rank sum test was used to compute the p value (primary_sensitive: n = 19; primary_resistant: n = 7). C, D, F Only primary tumors are included. In the box plots, the middle line in the box is the median, the bottom, and top of the box are the first and third quartiles, and the whiskers extend to 1.5× interquartile range of the lower and the upper quartiles, respectively.

