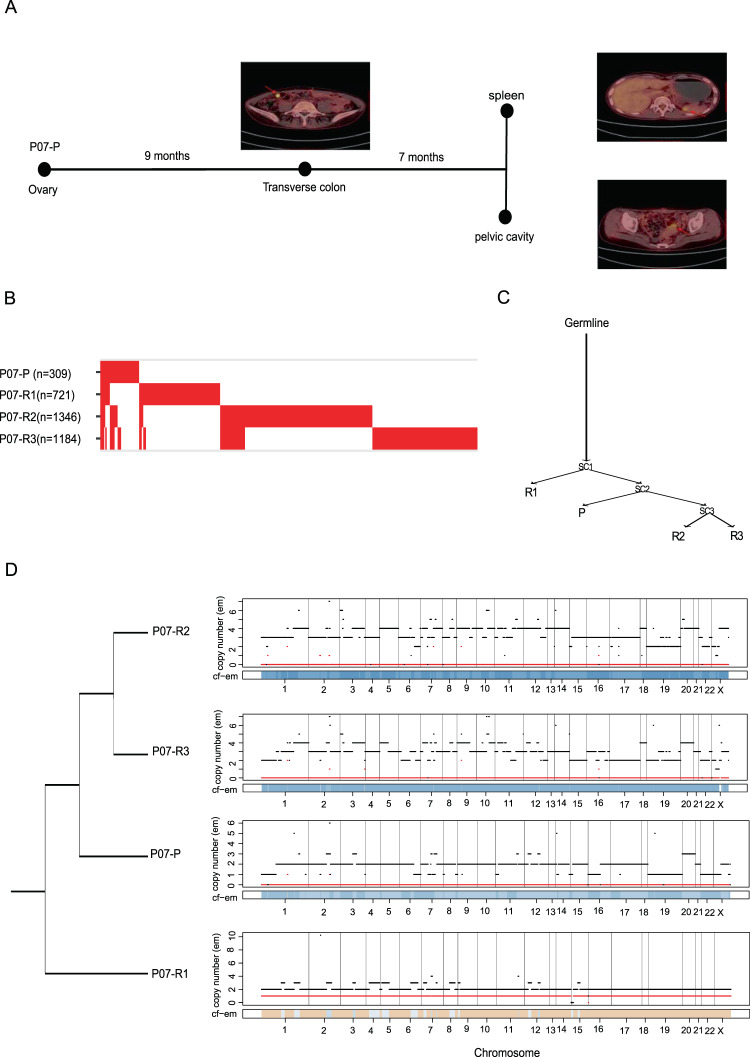
Fig. 5. Evolution of YST progression from a single patient.
A The PET-CT tomography of patient P07 at different diagnostic time points. B The alignment of all mutations in the primary and three relapse tumor samples from P07. The mutation numbers included in the analysis are shown in parentheses. C A phylogenetic tree showing evolutionary relationships between the tumor samples. Selected mutations are shown along the lineages. D A phylogenetic tree among the four tumor samples from P07 based on their LOH patterns.

