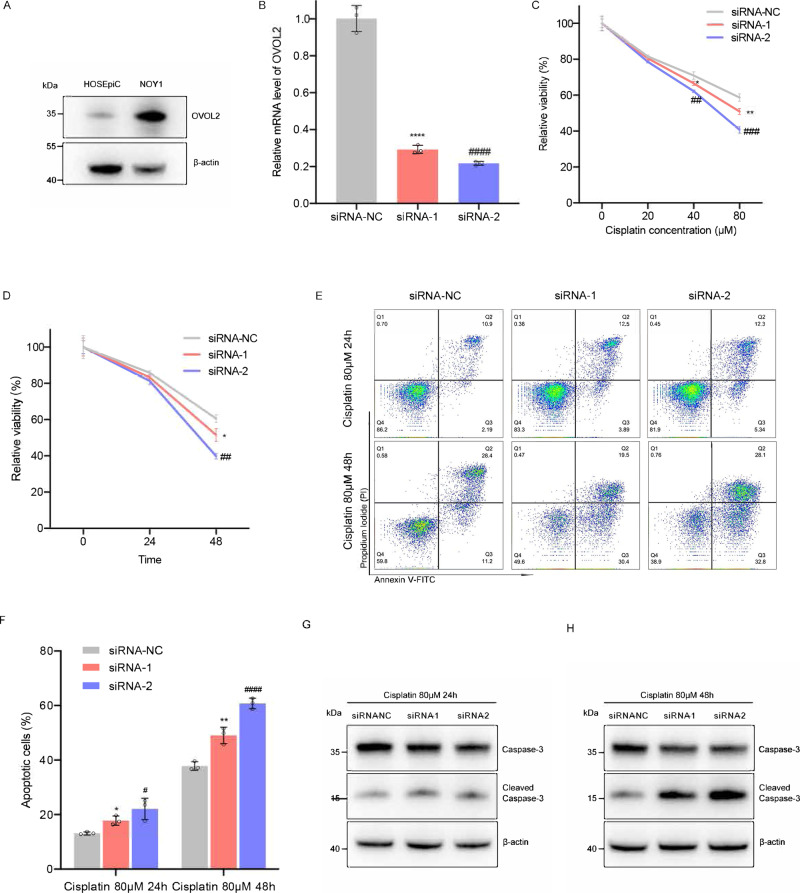
Fig. 7. The effect of OVOL2 expression on the sensitivity of NOY1 cell lines to cisplatin.
A The protein level of OVOL2 in HOSEpiC and NOY1 cells by western blot. B The relative mRNA expression levels of OVOL2 in control and siRNA-knockdown cells. N = 3 independent experiments. Two-tailed Student’s t-test, siRNA-NC vs. siRNA-1: p < 10−4, siRNA-NC vs. siRNA-2: p < 10−4. C Drug response across different drug concentrations. NOY1 cells were transfected with siRNAs for 48 h and further treated with gradient concentration of cisplatin (0, 20, 40, 80 µM) for additional 48 h. Cell viability was detected by CellTiter-Glo assay and the relative viability was normalized to the respective noncisplatin-treated conditions. N = 3 independent experiments. Two-tailed Student’s t-test, at 40 µM cisplatin treatment condition, siRNA-NC vs. siRNA-1: p = 3.5 × 10⁻², siRNA-NC vs. siRNA-2: p = 2.3 × 10⁻³; at 80 µM cisplatin condition, siRNA-NC vs. siRNA-1: p = 7.2 × 10⁻³, siRNA-NC vs. siRNA-2: p = 4.0 × 10⁻⁴. D Drug response across different treatment time points. NOY1 cells were transfected with siRNAs for 48 h and further treated with 80 µM cisplatin. Cell viability was detected by CellTiter-Glo assay at 0, 24 and 48 h, and the relative viability was normalized to the respective 0 h conditions. N = 3 independent experiments. Two-tailed Student’s t-test, siRNA-NC vs. siRNA-1; p = 1.9 × 10⁻², siRNA-NC vs. siRNA-2: p = 2.0 × 10⁻⁴. E–H NOY1 cells were transfected with siRNAs for 48 h and further treated with 80 μM cisplatin for additional 24–48 h. Cell apoptosis and expression levels of marker proteins in apoptosis (Caspase-3 and cleaved Caspase-3) were determined by flow cytometry (E, F) and western blot (G, H). N = 3 independent experiments. Two-tailed Student’s t-test, at 24 h, siRNA-NC vs. siRNA-1: p = 1.0 × 10⁻⁴, siRNA-NC vs. siRNA-2: p < 10−4; at 48 h, siRNA-NC vs. siRNA-1: p < 10−4, siRNA-NC vs. siRNA-2: p < 10−4. For all in vitro experiments in this study, each one was repeated three times. (A, G and H), β-actin was used as internal control. Uncropped blots of figures are shown in Supplementary Fig. 7. (B, C, D and F), Error bars are presented as means ± s.d. P values were analyzed by two-tailed Student’s t-test. */#p < 0.05, **/##p < 0.01, ***/###p < 10−3, and ****/####p < 10−4.

