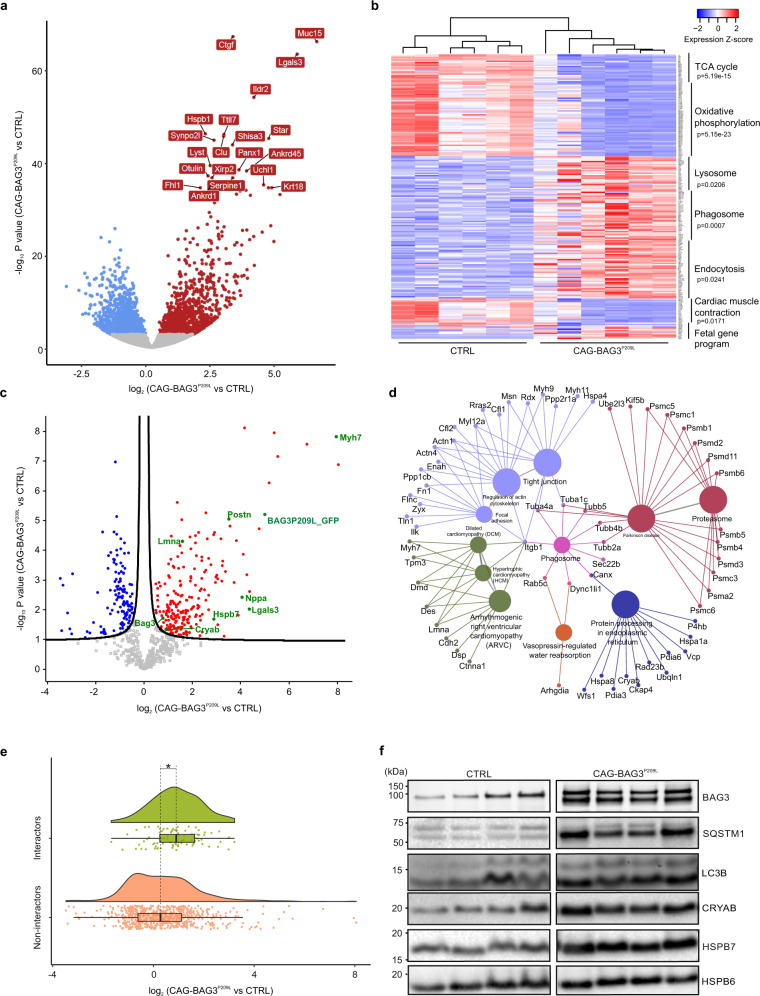
Fig. 5. RNA-Seq-based transcriptome and proteome analysis of hearts from CAG-BAG3P209L and control mice.
a, b RNA-Seq analysis revealed differential gene expression in hearts from 5-week-old CAG-BAG3P209L mice (n = 6 mice) compared to CTRL (n = 6 mice). Volcano plot showing false discovery corrected q-values and log2(fold)-changes. Blue and red dots depict genes depleted and enriched respectively in CAG-BAG3P209L mice compared to CTRL. Names of the 20 most differentially expressed genes are shown. b Same hearts as in (a). Gene expression heatmap for significantly (P < 10−6 Bonferroni step down corrected for multiple comparison) enriched KEGG pathways identified by ClueGO (two-sided hypergeometric test) and selected genes from a fetal cardiac gene program found in pathological hypertrophy (Myh6, Atp2a2, Atp2b4, Hand2, Gata6, Mef2c, Nkx2-5, Gata4, Acta1, Lmna, Myh7, Nppa, Nppb). c Volcano plot from proteome analysis of hearts from 5-week-old CAG-BAG3P209L vs CTRL mice. Blue and red dots depict the proteins significantly depleted and accumulated respectively in the CAG-BAG3P209L mice compared to the CTRL (Two-sided Student’s T-test p-value <0.05, FDR < 0.05, S0 = 0.1). d KEGG term analysis of proteins with significantly increased abundance in CAG-BAG3P209L mice compared to CTRL mice. e Raincloud plots illustrate the change in protein abundance in hearts of CAG-BAG3P209L compared to CTRL mice for proteins known to interact with hBAG3 (n = 86) and all others (n = 629). In the box plot, center lines show the medians with box plot limits indicate the 25th and 75th percentiles. Box plot whiskers extend to 1.5x interquartile range from the 25th and 75th percentiles. Asterisk indicates a significant difference between both populations (Two-sided Mann–Whitney rank sum test, p-value 5.7E−6). f Immunoblot analysis of hearts from 5-week-old mice revealed the presence of hBAG3 and a significant increase in the amount of mouse Bag3 in CAG-BAG3P209L mice in comparison to CTRL mice. CAG-BAG3P209L mice had nearly as much hBAG3 as mouse Bag3. Note significant increases in the expression levels of the heat shock proteins HSPB7 and α-B crystallin, and the autophagy marker p62. Expression was normalized to the expression level of α-actin. The data were obtained from four independent biological replicates and not technically repeated. CTRL, control mice (siblings of CAG-BAG3P209L mice, which are either WT, PGK-Cre, or CAG-flox-hBAG3P209L).

