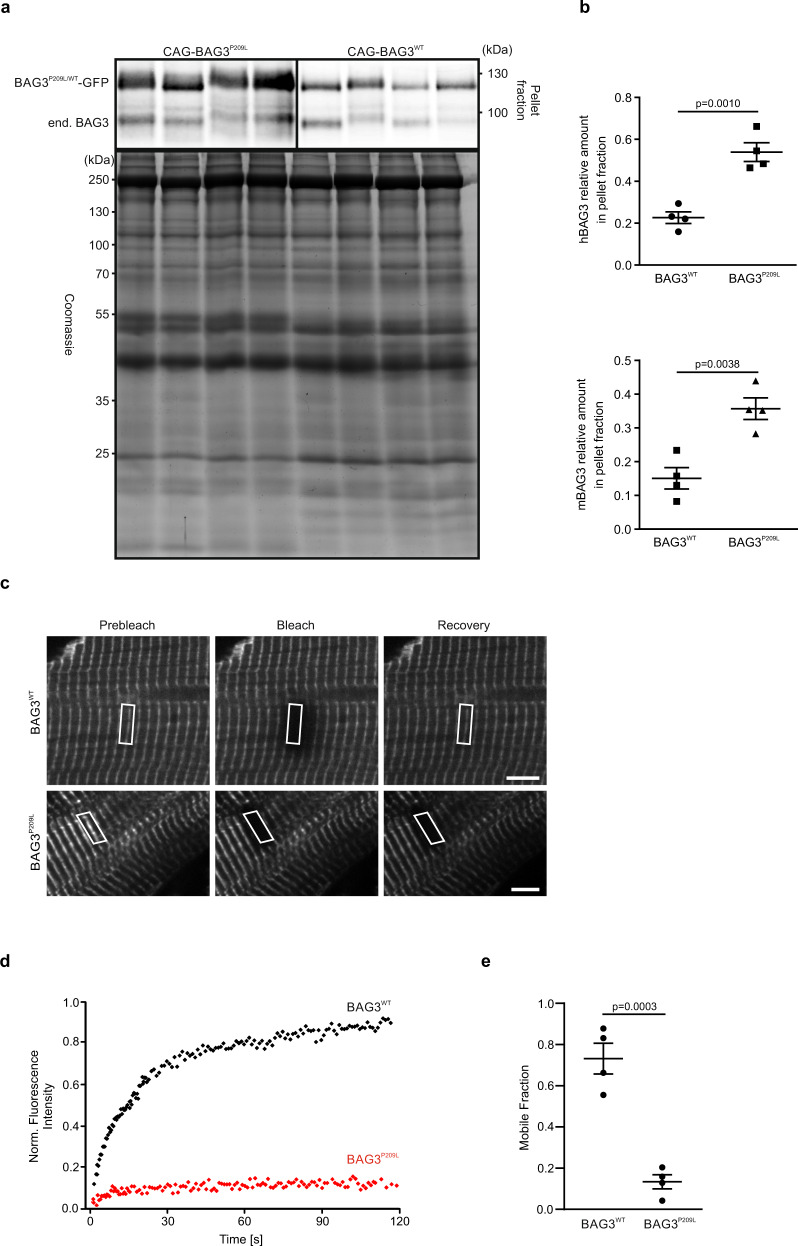
Fig. 6. Reduced solubility and dynamics of hBAG3P209L.
a Protein extracts from hearts of 5-week-old CAG-BAG3P209L and CAG-BAG3WT mice were prepared and analyzed by differential centrifugation and subsequent immunoblotting. BAG3P209L-eGFP was predominantly found in the insoluble pellet fraction and seemed to have sequestered endogenous mouse Bag3 into the insoluble fraction. b Quantification of the amount of hBAG3 and endogenous mBag3 in the pellet fraction. Mean ± SEM. n = 4 hearts per group. Two-sided Student’s T-test. c–e Langendorff-isolated BAG3-eGFP-expressing CMs from hearts from 10-week-old αMHC-BAG3WT and αMHC-BAG3P209L mice were analyzed by FRAP. Shown is a time series of fluorescence micrographs indicating the localization of hBAG3WT and hBAG3P209L at Z-discs. c Regions of interest (indicated by white boxes) were followed over time and are shown before bleaching (“Prebleach”), immediately after bleaching (“Bleach”), and after 1 min of fluorescence recovery (“Recovery”). Scale bars: 5 µm. d Typical recovery profiles of hBAG3WT and hBAG3P209L. Note very fast recovery of hBAG3WT, whereas hBAG3P209L fluorescence is essentially not recovering at all during the time of observation. e Bar plot summarizing mobile fractions of hBAG3WT (73%) and hBAG3P209L (13%) in Z-discs. Note the considerably higher dynamics of hBAG3WT in comparison to hBAG3P209L. Mean ± SEM. n = 8 CMs per group. Two-sided Student’s T-test.

