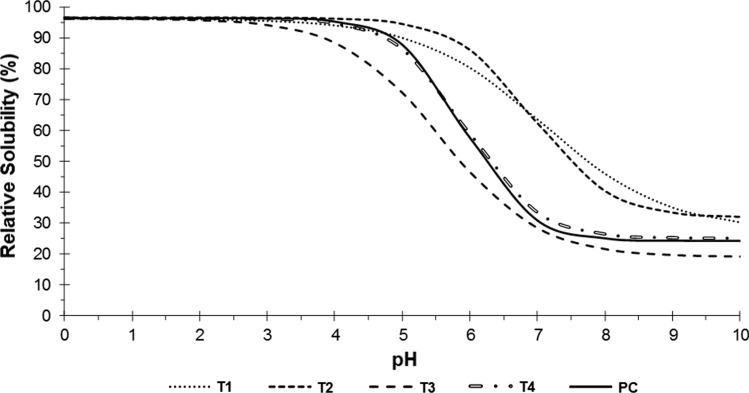
Fig. 3.
Relative solubility curves as a function of the pH (0 to 10) of the collagen from chicken MSM residue extracted according to 22 factorial design. T1: 30 min of pre-treatment with ultrasound and 24 h of enzymatic extraction; T2: 30 min of pre-treatment with ultrasound and 48 h of enzymatic extraction; T3: 48 h of enzymatic extraction; T4: 24 h of enzymatic extraction; PC: 15 min of pre-treatment with ultrasound and 36 h of enzymatic extraction

