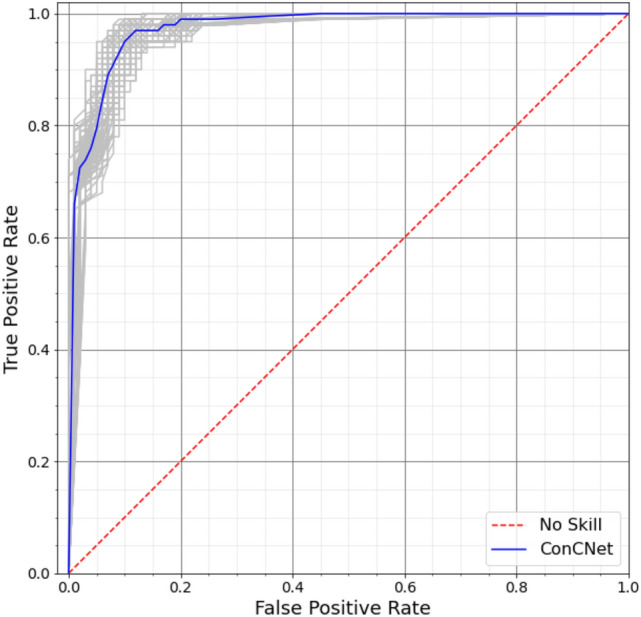
Figure 4.

The Receiver Operating Characteristic (ROC) curves for the 100 LSTM networks. The grey curves show the results for each of the 100 networks and the blue curve shows the median. The ensemble median Area Under the Curve (AUC) is 0.971 (the 25% and the 75% percentile are 0.963 and 0.975, respectively). A classifier with no better accuracy than chance would be expected to have an AUC of 0.5, while an AUC of 1 corresponds to a classifier with perfect accuracy. A value of indicates a classifier with excellent discriminatory ability78. (Plotted with Matplotlib v3.2.175).
