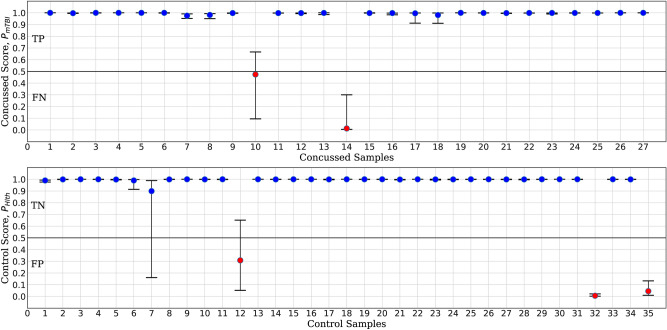
Figure 5.
Statistics of the output layer scores for each participant in the concussed (upper panel) and control (lower panel) groups. The scores distributions are obtained from the Monte Carlo cross validation tests in Stage 3. The statistics shown include the median (circle markers) and the 25th and 75th quartiles (whiskers) of the concussion scores for the 27 concussed participants (upper panel). For the 35 control participants, the statistics involve the median and respective quartiles of the complementary scores . Correctly classified participants (blue markers) have a median concussion score exceeding the threshold of 0.5 (concussed group) and respectively below 0.5 (control group). Correct classifications include true positives (TP) in the concussed group and true negatives (TN) in the control group. Red markers correspond to individuals who were misclassified based on their median scores; these involve two false negatives (FN) in the concussed group and three false positives (FP) in the control group. (Plotted with Matplotlib v3.2.175).

