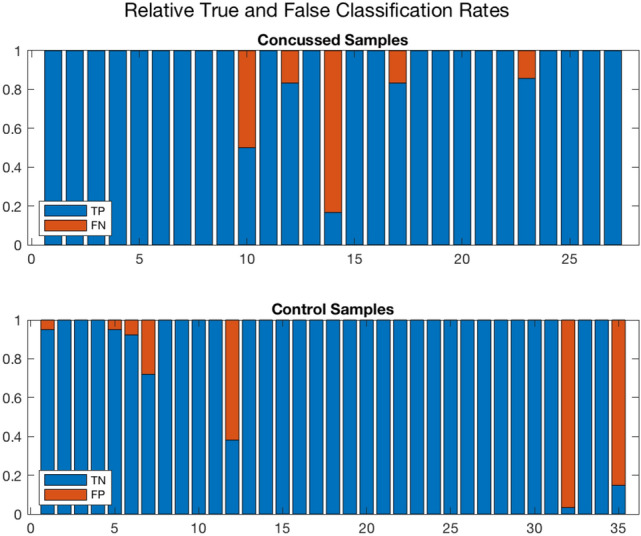
Figure 6.

A different representation of the Monte Carlo cross validation test results for the 27 concussed and 35 control samples. The blue and red regions in each column illustrate the relative fractions of times that a participant was properly or wrongly classified by the ensemble of networks. This figure is complementary to Fig. 5 which shows the median and quartile scores for each participant. Three control and two concussed participants tended to be systematically misclassified by the networks in the ensemble. A handful of other participants were sometimes misclassified by one or two of the networks. On further examination, the training of the latter involved an EEG sample from one of the misclassified individuals. (Plotted with Matlab R2020a79).
