Figure 4.
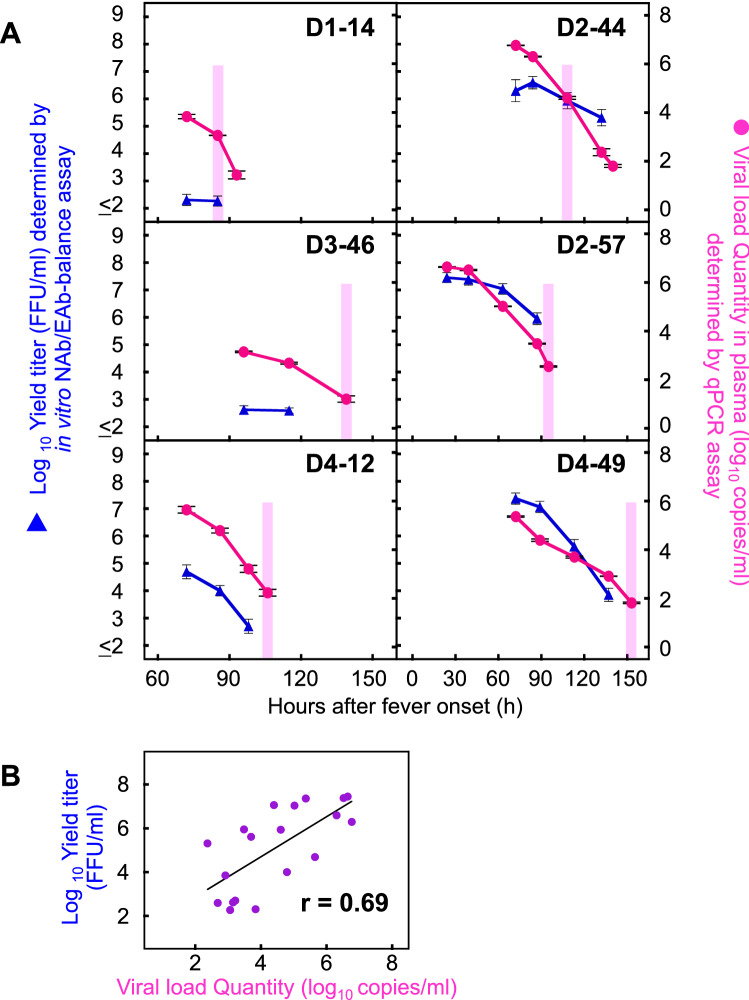
Relationship between in vitro ADE activity and in vivo viral load quantity. (A) The NAb/EAb-balance assay was conducted with a combination of serum diluted at 1:10 and the corresponding autologous virus. Culture supernatants were harvested at 24 h after the mixture of serum, virus and K562 cells. The infective titers were determined on Vero cells and plotted as the left ordinates (blue triangles: expressed as log10 FFU/ml). The number of viral RNA copies in plasma samples collected at same time points as well as one extra time point (D1-14: 93 h, D2-44: 140 h, D3-46: 139 h, D2-57: 95 h, D4-12: 106 h and D4-49: 153 h) were determined by real time RT-PCR, and plotted as the right ordinates (red circles: expressed as log10 copies/ml). The abscissae indicate time (h) after fever onset. Pink shading indicates the beginning of defervescence on the clinical observation. (B) Correlation between the ADE progeny virus titers and the viral RNA copy numbers. The correlation coefficient (r) was estimated for the individual progeny virus titers and qPCR values obtained in Fig. 4A (however, following samples were excluded; D1-14: 93 h, D2-44: 140 h, D3-46: 139 h, D2-57: 95 h, D4-12: 106 h and D4-49: 153 h). The abscissa and ordinate indicate the qPCR values and the progeny virus titers, respectively. Linear regression lines and r values are presented in the panel.

