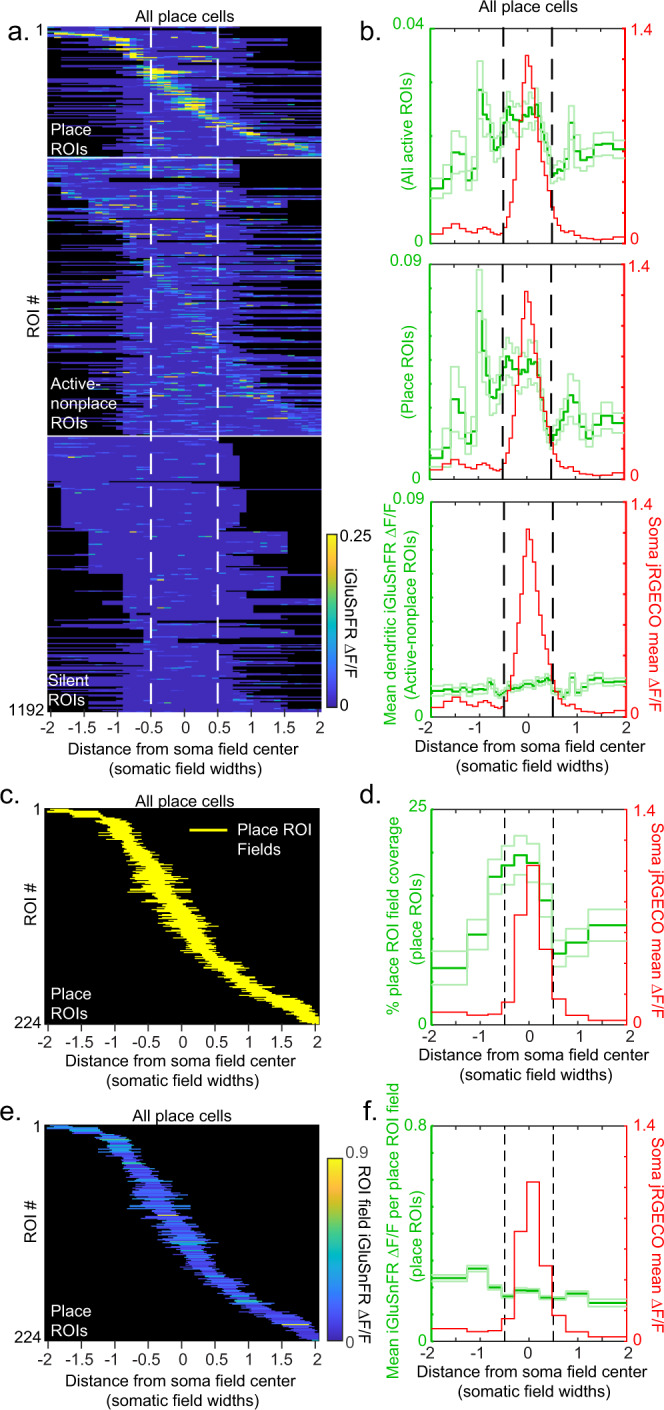
Fig. 3. Total excitatory input is greater in the somatic place field versus out.

a Mean iGluSnFR ΔF/F versus position from somatic place field center (in units of somatic place field width) across all traversals of a single session for all ROIs (each row represents single ROI mean ΔF/F) from all 62 branches of all 23 place cells (same ROIs as shown in Fig. 2h). Mean somatic place field between dashed lines. Plotted via cross-validation within each ROI category. b Mean total excitatory input (green) as a function of distance from the center of the mean somatic place field (red) for all active ROIs (top), all place-ROIs (middle), and all active–nonplace-ROIs (bottom). Mean (dark green) ± SE (light green). c, d. All place-ROI fields (yellow) versus position from somatic place field center (each yellow dash is a separate place-ROI field) (c) and percentage of place-ROIs with place-ROI field coverage (green) of binned positions from the center of mean somatic place field (red; (d), bin size different than in b). e, f. All place-ROI fields colored by their (mean) ROI field ΔF/F versus position from somatic place field center (e), and mean ΔF/F per place-ROI field (green) versus position from the center of mean somatic place field (red; (f), bin size different than in (b). Source data are provided as a Source Data file for b, d, and f.
