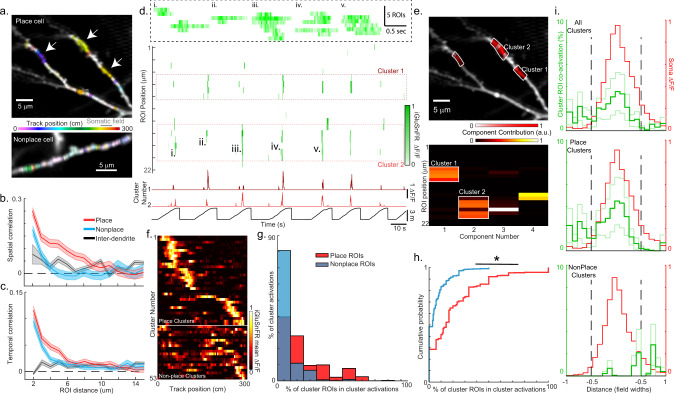
Fig. 4. Excitatory inputs are more temporally co-active and anatomically clustered in the somatic place field versus out.
a Dendritic segments from a place cell (top) and nonplace cell (bottom) with ROIs colored according to the center of mass of each ROI’s mean ΔF/F map. The brightness indicates peak ΔF/F value in the mean ΔF/F map divided by the spatial dispersion. Track location of somatic place field for place cell (top) shown in gray. Similar results were obtained from 23 place cells and 23 nonplace cells from 11 mice. b Spatial correlation (Pearson’s correlation) between the mean ΔF/F maps of all pairs of active ROIs on a single branch versus the dendritic distance between the pairs of ROIs, averaged over all branches from place (red) or nonplace (blue) cells. Inter-dendrite spatial correlation versus Euclidean distance for pairs of ROIs that belonged to different branches co-recorded in the same field averaged over all pairs of branches from all dendritic iGluSnFR recordings (black). Shaded regions, SEM. c Temporal correlation versus dendritic distance plots calculated as in panel (b), except significant transient-only traces were used instead of mean ΔF/F maps. Shaded regions, SEM. d Matrix of significant iGluSnFR ΔF/F transient vs time traces (green, 100 ms bins) for 22 neighboring ROIs from the top branch shown in panel (a, top) acquired during linear track navigation (track position at the bottom, black). ROIs for the 2 functional clusters from panel (e, bottom) outlined in red dashed boxes and the associated cluster ΔF/F vs time traces shown in red (bottom). The expanded time base for five events (i–v) shown in the black dashed box inset. Note that cluster activations (nonzero cluster ΔF/F) could occur as coactivation of all cluster ROIs, some of the cluster ROIs (often nonadjacent), or just one cluster ROI. e Bottom, non-negative independent components for the matrix shown in (d) (top), with 2 functional clusters highlighted in white. Top, Dendritic segments shown in (a), but ROIs belonging to 3 different functional clusters are highlighted in white. Similar results were obtained from 23 place cells and 23 nonplace cells from 11 mice. f Mean cluster iGluSnFR ΔF/F versus track position across all traversals of a single session for all functional clusters (each row represents single-cluster mean ΔF/F) from all place and nonplace cells. Plotted via cross-validation within each cluster category. g Histogram of percent of place (red) or active–nonplace (blue) ROIs that were part of a cluster that was co-active during a cluster activation (nonzero cluster ΔF/F). h Cumulative probability from histograms shown in panel (g). *p = 2.7e−117, Rank-sum test, two-sided. i Mean cluster ROI coactivation (green, percentage of cluster activations with > 70% cluster ROI coactivation) as a function of distance from the center of the mean somatic place field (red) for all clusters (top), all place clusters (middle), and all active–nonplace clusters (bottom). Mean (dark green) ± SE (light green). Source data are provided as a Source Data file for b, c, g, h, and i.

