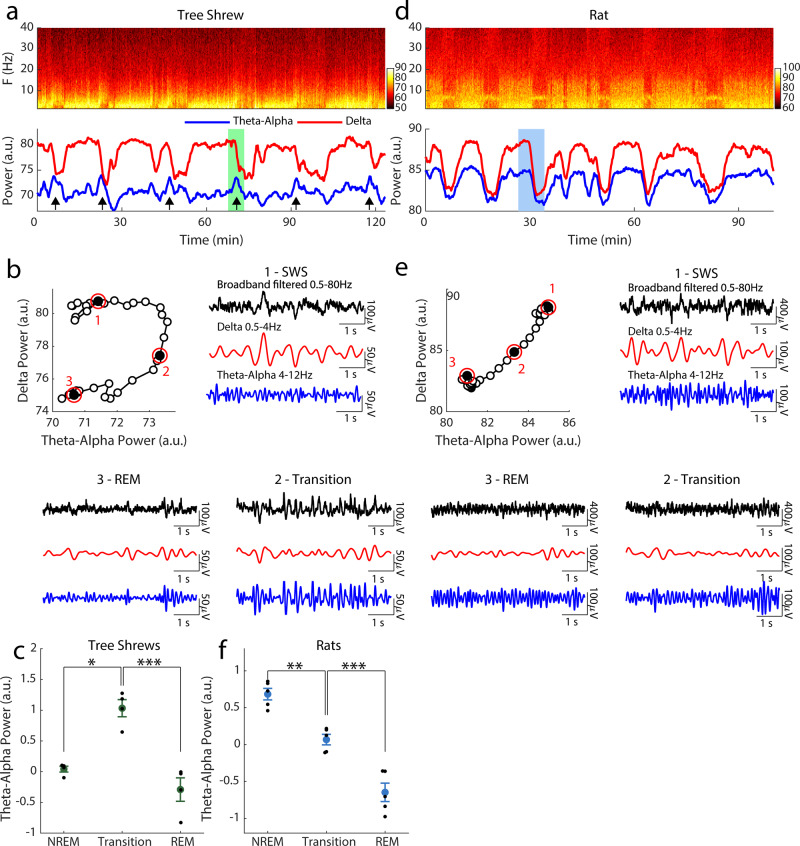
Fig. 1. Dynamics of the transition episodes in tree shrews and rats.
Spectrograms of example segments of tree shrew (a) and rat (d) sleep, with the corresponding delta power, red (0.5–4 Hz) and theta-alpha power, blue, (4–12 Hz) shown below. Black arrows indicate periods of increased theta-alpha power accompanying NREM/REM transitions. Selected transitions for tree shrew and rats are shown in (b) and (e) respectively. Top level panels show delta vs. theta-alpha power for the sleep segments highlighted in (a) and (d). Circled epochs 1–2 are expanded in the surrounding numbered panels, showing the corresponding filtered LFP traces. Note that in the example rat delta and theta-alpha power decrease together while in the tree shrew an initial decline in delta power is accompanied by a transient increase at the theta-alpha band, see arrows in (a). Indeed this transient increase in theta-alpha power during transitions was significant for the population of tree shrews (n = 4) as shown in (c), while theta-alpha significantly decreased during transitions in rats (n = 5) as shown in (f), paired t-tests, *p < 0.05, **p < 0.01, ***p < 0.001. Error bars reflect the standard error of the mean. Color bars reflect Fourier power in arbitrary units.

