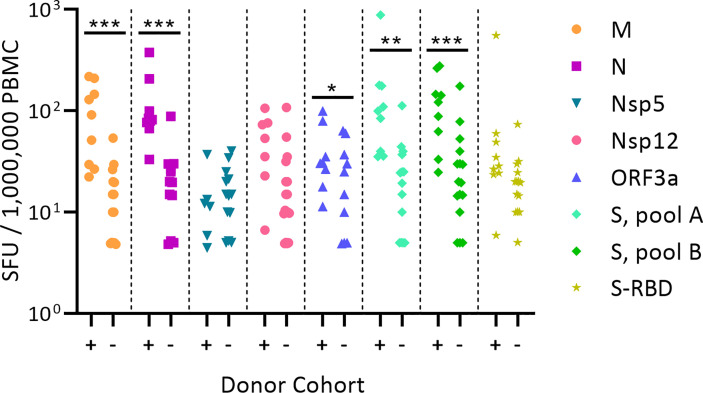
Figure 1.
Classic representation of SARS-CoV-2 antigen-specific T cell frequencies in SARS-CoV-2 PCR verified subjects(+) versus Pre-COVID Era individuals(-). PBMC of each individual within the cohort is represented by a dot. The PBMC were challenged with peptide pools covering the SARS-CoV-2 antigens specified on the right. (These peptide pools are closer defined in Supplementary Table 2 ). The individual peptides in each pool were tested at 1.5 µg/ml. An ELISPOT assay was performed measuring the numbers of antigen-induced IFN-y-secreting T cells (spot forming units, SFU) in 200,000 PBMC; following convention, the numbers have been normalized to per million PBMC, as shown on the Y axis. Statistical significance between the two cohorts was determined using an independent samples t test. Significant differences between SARS-CoV-2-infected vs. non-exposed cohorts are marked with * denoting p < 0.05, ** p < 0.01, and *** p < 0.001, respectively.

