
FIGURE 3.
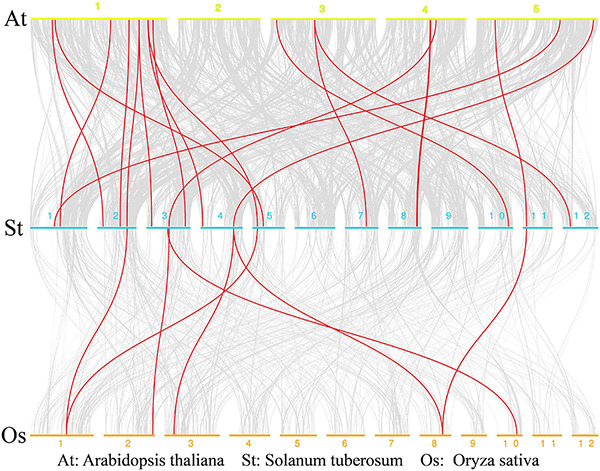
Collinearity analysis of multidrug and toxic compound extrusion (MATE) genes in rice, potato, and Arabidopsis. Chromosomes of Arabidopsis, potato, and rice are represented by yellow, blue, and orange bars, respectively; the chromosome label is next to the corresponding chromosome. The red curve indicates MATE genes with collinearity.