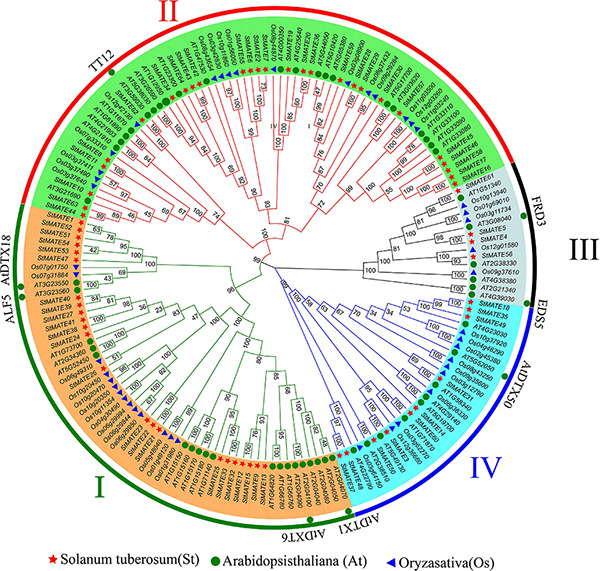
FIGURE 4.

Phylogenetic tree of Arabidopsis, rice, and potato multidrug and toxic compound extrusion (MATE) proteins. The picture represents the phylogenetic tree as constructed by the N-J (neighbor-joining) method where the number on the branch represented the bootstrap values. Subfamilies are marked in different colors, with each subfamily marked outside the circle as I, II, III, and IV. The red star, blue triangle, and green circle represented potato, rice, and Arabidopsis MATE proteins, respectively.
