
FIGURE 5.
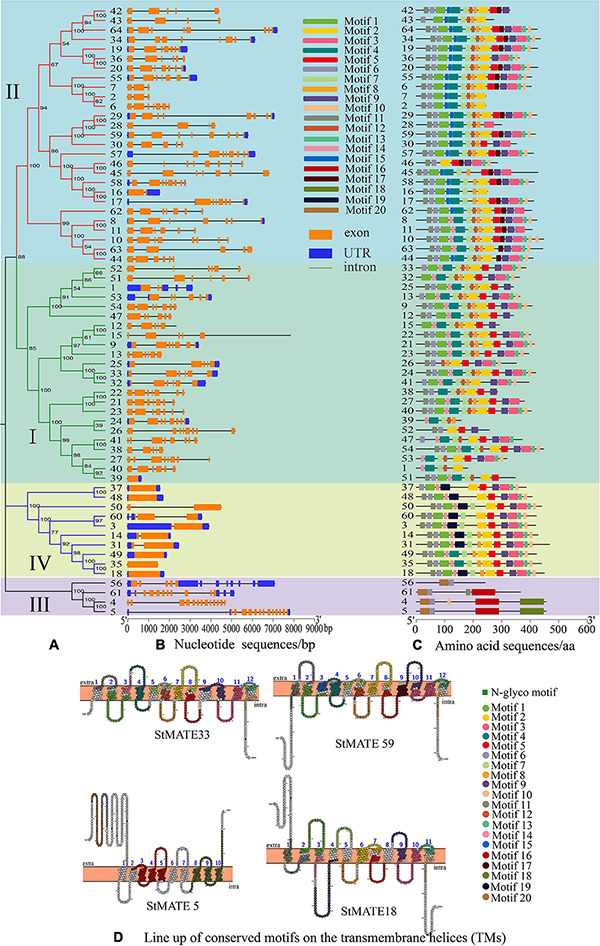
Analysis of motifs, transmembrane helices (TMs), and exon–intron structure of StMATE genes. The numbers 1–64 represent StMATE1–StMATE64. (A) Phylogenetic tree, the various subfamilies were numbered I, II, III, and IV. (B) Gene structures of StMATE genes, orange boxes, blue boxes, and lines represented exon, untranslated region (UTR), and introns, respectively. The lengths of the boxes and lines were scaled according to the gene length. (C) All motifs were identified by MEME (v4.12.0) according to the complete amino acid sequences. (D) Lineup of conserved motifs on the TMs. The transmembrane structure is marked with blue numbers, the conserved motif is indicated in different colors, and its related information is on the right.