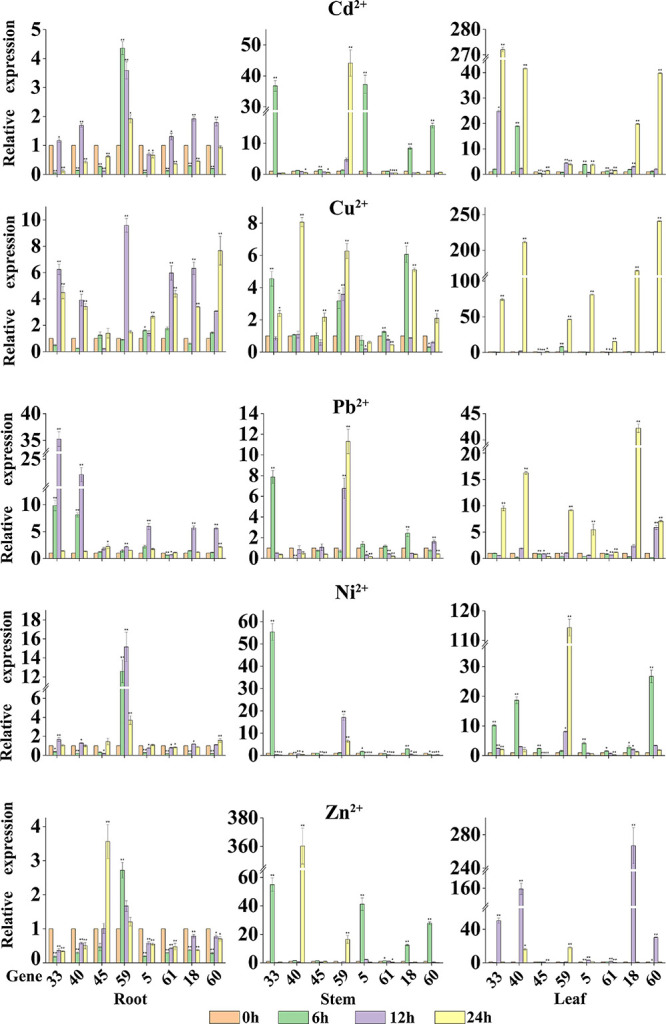
FIGURE 7.

The relative expression levels of eight StMATE genes in response to the five heavy metals. The ordinate is the gene expression level; abscissa is the gene number. The height of the bar graphs represents the relative expression levels of the genes where the value of the expression is equal to the means (±SD) of three biological replicates. The gene names are shown on the x axis (*P < 0.05; **P < 0.01).
