FIGURE 8.

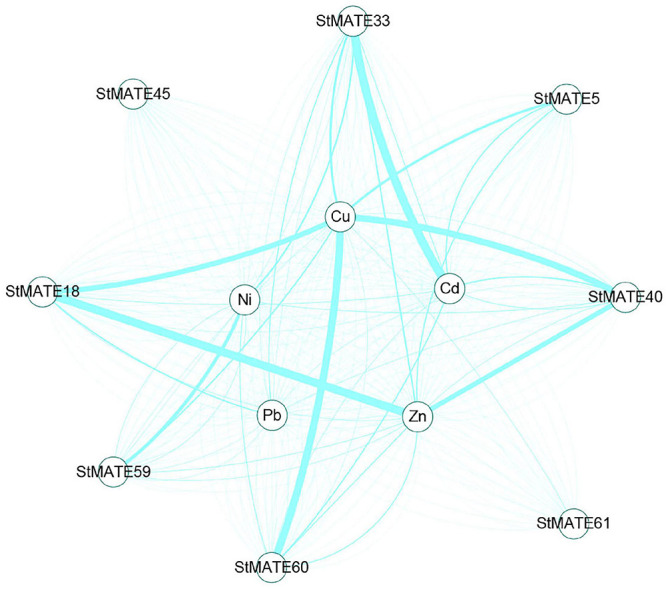
Analysis of co-expression network of StMATE genes. The thicker the line between metals and genes indicates the higher expression of the gene under the metal stress condition.

Analysis of co-expression network of StMATE genes. The thicker the line between metals and genes indicates the higher expression of the gene under the metal stress condition.