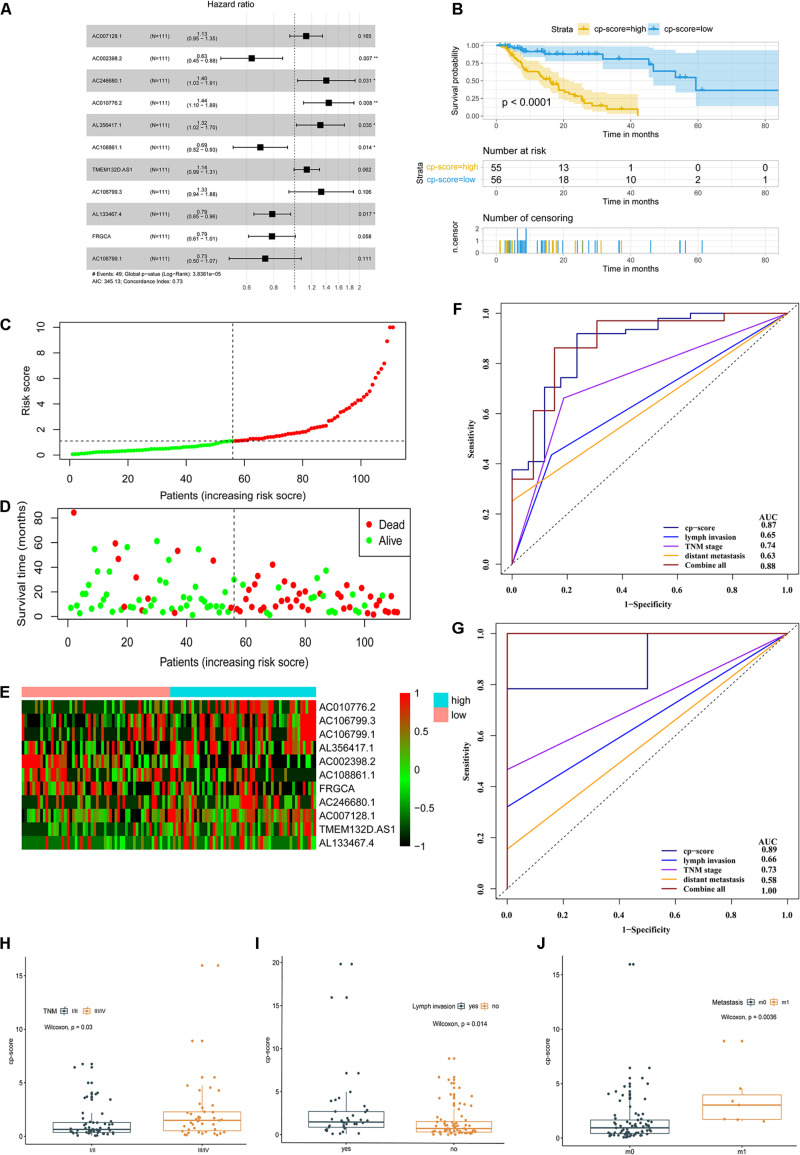
FIGURE 2.
A prognostic model of ESCC survival based on 11 differential and prognostic lncRNAs. (A) Forest plot illustrated the HR and 95% CI of the 11 lncRNAs by the multivariate Cox regression. HR, hazard ratio; CI, confidence interval. (B) OS curves of ESCC patients with the low and high risk groups according to the cp-score in TCGA cohort. (C–E) The distribution of 11-lncRNA risk score (C), OS status (D), and corresponding lncRNA expression profiles (E). The intersection of horizontal and vertical dotted lines represents the risk score of the person ranked in the middle. (F) Time-dependent ROC and corresponding AUCs for 3-year survival predicted by cp-score, TNM stage, lymph node metastasis, distant metastasis, and the combination of all these factors. (G) ROC and corresponding AUCs for 5-year OS predicted by cp-score, TNM stage, lymph node metastasis, distant metastasis, and the combination of all these factors. (H) LncRNA analysis of cp-score of patients with stage I/II and stage III/IV disease. (I) cp-score in patients with and without lymph node metastasis. (J) cp-score in patients with and without distant metastasis.

