Figure 5.

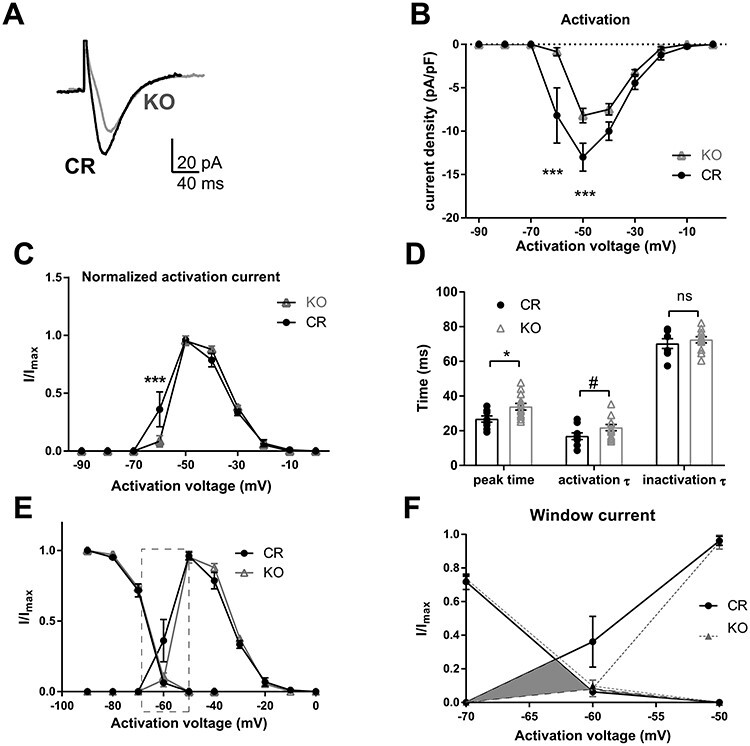
Properties of T-type calcium currents in PVA neurons of CR and Shox2 KO mice. The T-type calcium currents were isolated using voltage-clamp recordings according to methods. A. An example of T-type calcium currents recorded from PVA neurons of CR and Shox2 KO mice. T-type calcium currents in Shox2 KO mice are smaller in amplitude and slower than in CR mice. B. The current density curve of T-type calcium current activation. T-type calcium current density is smaller in PVA neurons of KO mice compared with CR mice (***, P < 0.001). C. The normalized activation curves indicate that T-type calcium (I/Imax) is larger at −60 mV in CR mice than that in KO mice (***, P < 0.001). D. Summary plot showing the time to peak (*, P < 0.05), activation and inactivation tau of the T-type current in TCNs from CR and KO mice. E. Inactivation and activation curves of T-type currents. F. Membrane potential range magnified to show T-type Ca2+ currents in −70 to −50 mV membrane potential window range.
