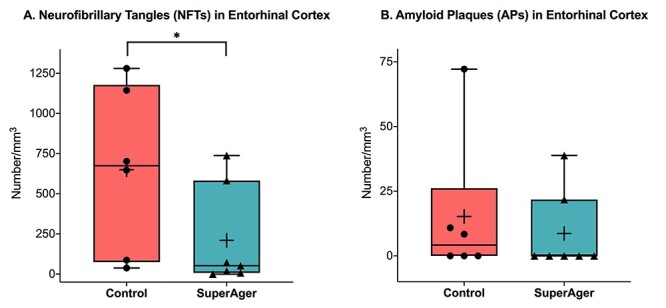
Figure 2.

Stereological density (number/mm3) of Thioflavin-S-positive NFTs (A) and APs (B) in the ERC of SAs versus age-matched cognitively average NCs. The middle, upper, and lower horizontal lines in the box plot represent the median, 75th, and 25th percentiles, respectively. The end of the vertical extensions above and below the box represents the extreme value that is at most 1.5 times the interquartile range above the 75th percentile or below the 25th percentile. The “+” represents the mean. *P < 0.05.
