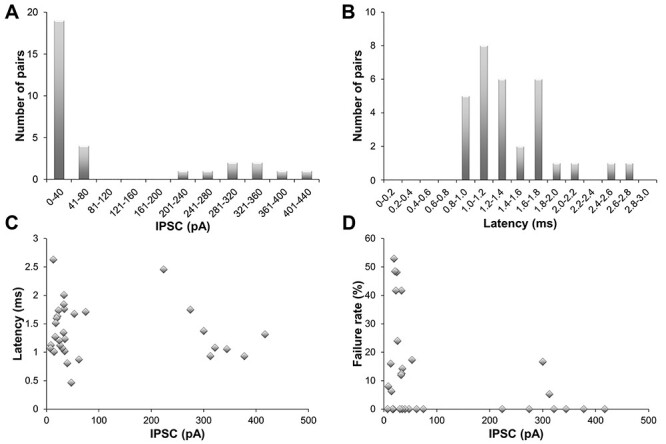
Figure 2.

Electrophysiology of PV+ interneurons. A. Frequency distribution of the IPSC amplitudes of all pairs (n = 31). B. Frequency distribution of the latencies of all pairs. C. Mean latencies plotted against mean IPSC. D. Failure rate against mean IPSC.
