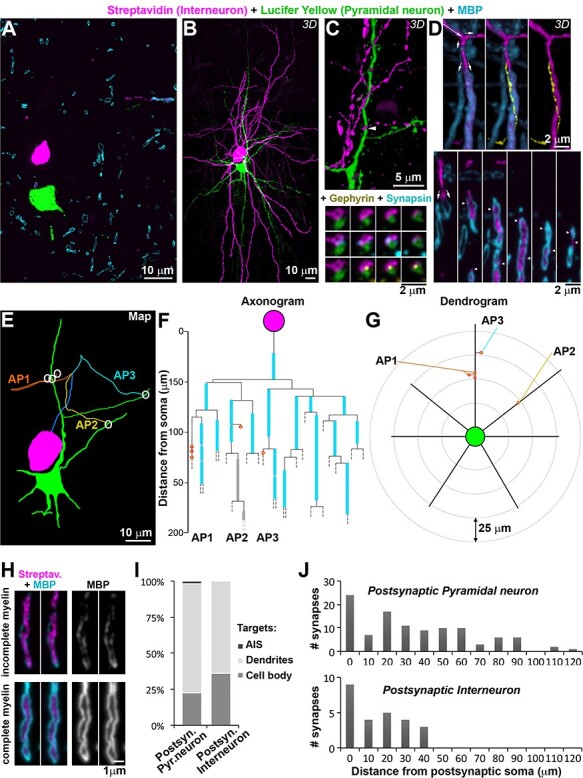
Figure 3.

Neuronal pair mapping. A. Single section (100 nm thick) from pair MK181212, aged 1 month, labeled with a Lucifer Yellow antibody (green, postsynaptic neuron), Streptavidin-Alexa594 (magenta, presynaptic interneuron) and MBP (cyan). B. MAX projection from the 727 sections through the same neuronal pair as A. C. Volume reconstruction of a synapse between the presynaptic axon and the postsynaptic dendrite (top, arrowhead), with serial sections through it (bottom) labeled with synapsin (cyan) and gephyrin (yellow). D. (Top) Volume reconstruction of an axonal segment, three different views. Long arrow indicates the direction of the axon, and small arrows—bifurcations. At the second bifurcation, the axon divides into 2 branches, one myelinated and one unmyelinated. The unmyelinated axonal branch is shown in yellow in the middle and right panel. (Bottom) Selected single sections through the volume, small arrows point to the bifurcation, and arrowheads point the unmyelinated branch profiles. E. Map of the neuronal pair, with synapses represented by white circles. Each axonal path (AP) is color-coded. The beginning common axonal path (axon initial segment and first internode) is in blue. F. Axonogram of the interneuron in the same pair, with myelin in cyan, and partial (incomplete) myelination in gray (example image shown in panel H). Synapses are represented as red circles, filled with orange (on dendrites) or yellow (spines). Dashed lines mark where the axons exited the traced volume. G. Dendrogram of the postsynaptic neuron. H. Example of incomplete myelin sheath (top) compared to complete myelin sheath (bottom). Two consecutive ultrathin sections are shown for each axon. I. Postsynaptic targets of interneurons, depending on the postsynaptic neuron cell type. J. Frequency distribution of the distances of each synapse from the postsynaptic cell body in the analyzed pairs. Pairs with postsynaptic pyramidal neuron (n = 11) are shown in the top plot, and pairs with postsynaptic interneuron (n = 3) in the bottom plot.
