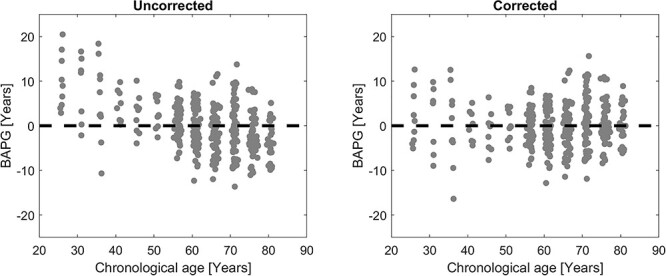
Figure 2.

Scatterplot of T5 BAPG versus chronological age for the Conc all model (a) before (MAE = 4.20 years) and (b) after (MAE = 3.64 years) age correction using linear regression. Before correction, young subjects on average get a higher predicted brain age than chronological age, while old subjects get a lower predicted brain age.
