Figure 6.

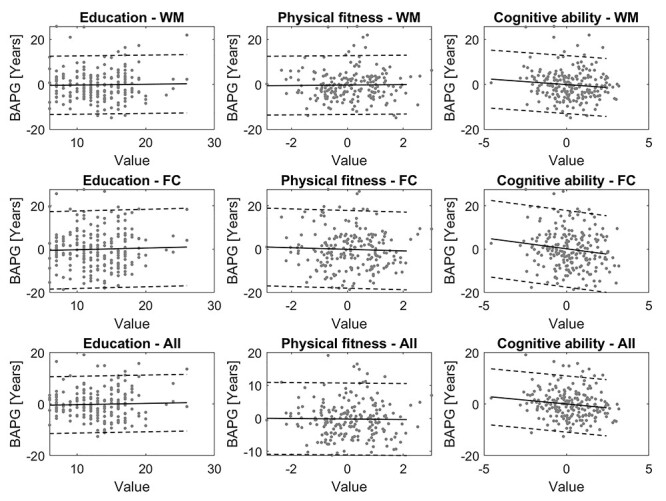
Scatterplots of education, physical fitness, and cognitive ability against BAPG at T5, calculated with WM, FC, and all modalities concatenated. Solid line shows the linear regression fitted to the data, and dashed lines M ± 2 SD.

Scatterplots of education, physical fitness, and cognitive ability against BAPG at T5, calculated with WM, FC, and all modalities concatenated. Solid line shows the linear regression fitted to the data, and dashed lines M ± 2 SD.