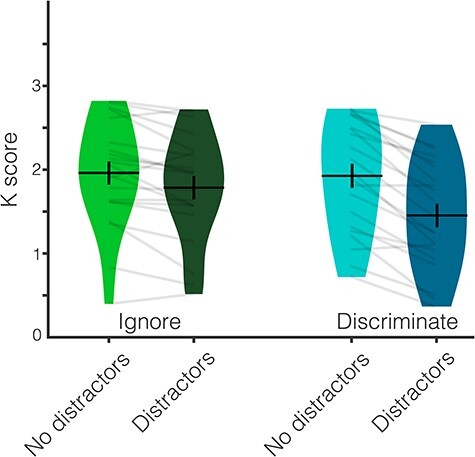
Figure 5 .

Behavioral results from Experiment 2. Behavioral performance (K score) across the four conditions. Participants remembered fewer items when they were distracted than when they were not distracted. This impact of distraction was larger when participants had to discriminate the distractors than when they could ignore them. Average K score is represented by the horizontal black line and the black error bars reflect the standard error of the mean. The distribution of K scores in each condition for all participants is represented by the violin plots. Light gray lines connect data from one participant across conditions.
