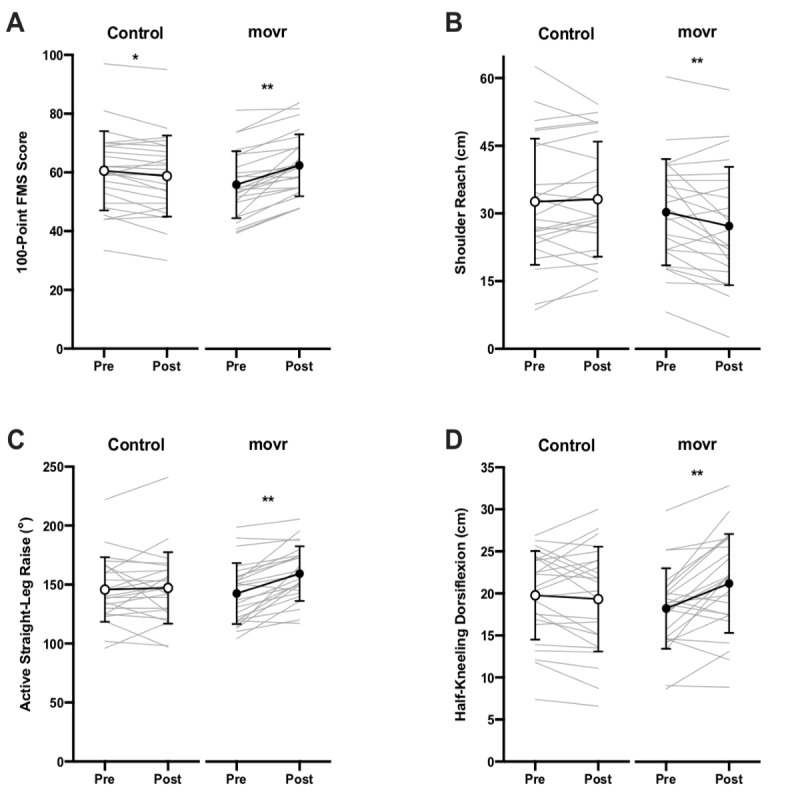
Figure 1.

Measurements of (A) 100-point Functional Movement Screen, (B) shoulder reach, (C) active straight leg raise, and (D) half-kneeling dorsiflexion before (pre) and after (post) the 8-week intervention period. Circles with black connecting lines represent sample means with SD error bars, whereas gray lines represent individual participant data points. Asterisks indicate significant differences between pre- and postintervention values within a given group (*P<.05; **P<.01). FMS: Functional Movement Screen.
