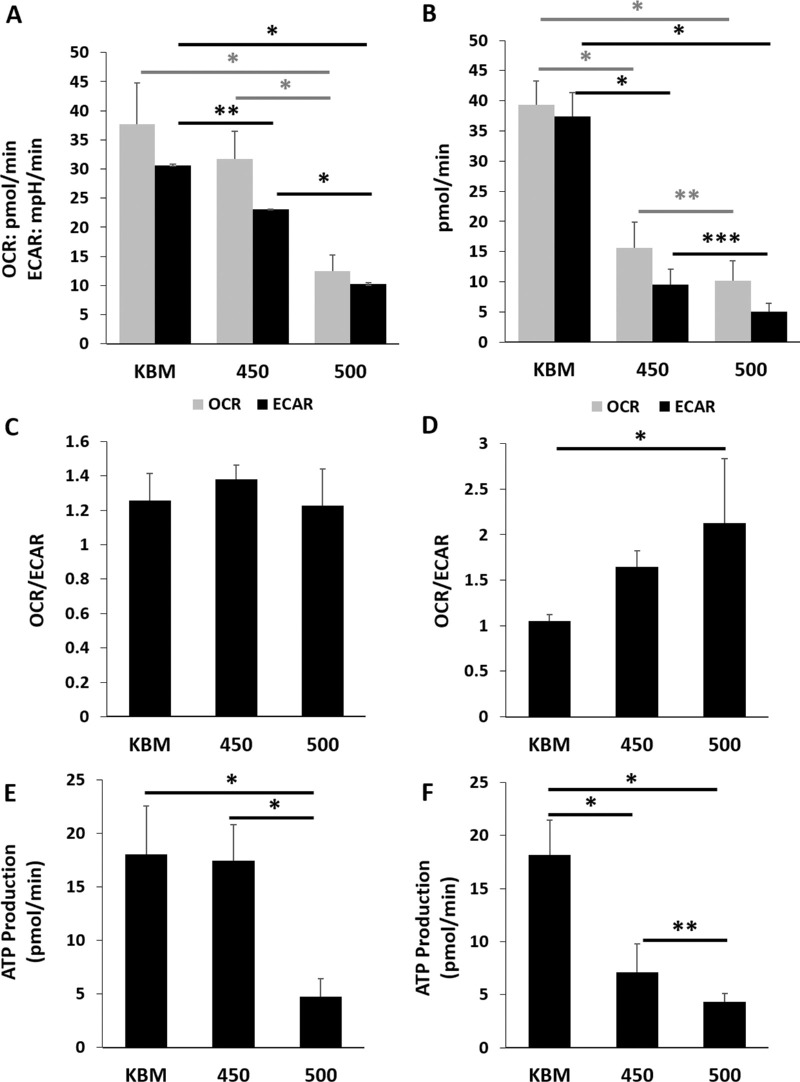
Figure 2.
Hyperosmolar stress decreases both mitochondrial respiration and glycolysis in corneal epithelial cells. The hTCEpi cells were cultured in basal media with increasing concentrations of salt. Metabolism was measured using a Seahorse metabolic flux analyzer after six and 24 hours of hyperosmolar culture. (A) At six hours of culture in 450 mOsM, glycolysis was significantly decreased compared to the basal control (**P = 0.021). It was further decreased with 500 mOsM (*P < 0.001). In contrast to this, respiration was not altered after six hours in 450 mOsM but was significantly decreased in 500 mOsM (*P < 0.001, one-way ANOVA, SNK multiple comparison test, n = 3). (B) After 24 hours of culture, glycolysis was severely attenuated in hyperosmolar culture (*P < 0.001, ****P = 0.017, one-way ANOVA, SNK multiple comparison test, n = 3). Mitochondrial respiration was similarly decreased (*P < 0.001, ***P = 0.035, n = 3). (C) There were no differences in the OCR/ECAR ratio at six hours (P = 0.248, one-way ANOVA, SNK multiple comparison test, n = 3). (D) hTCEpi cells expose to increased osmolarity shifted towards a more respiratory phenotype (P = 0.0005, one-way ANOVA, SNK multiple comparison test, n = 3). (E) ATP production was decreased after six-hour culture in 500 mOsM (*P < 0.001, one-way ANOVA, SNK multiple comparison test, n = 3). (F) After 24 hours, ATP production was decreased in both the 450 mOsM and 500 mOsM test groups (*P < 0.001). The greater osmolarity was associated with a greater decrease in ATP production (****P = 0.017, one-way ANOVA, SNK multiple comparison test, n = 3). Data represented as mean ± standard deviation. Graphs representative of a single experiment repeated three times. Number indicates mOsM.

