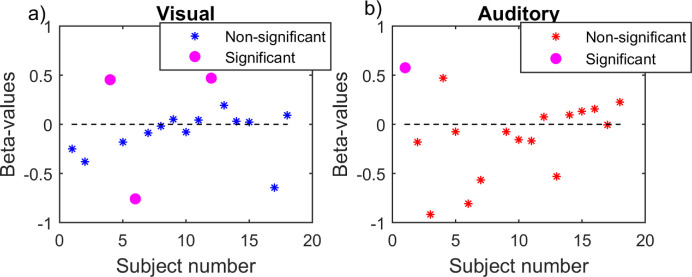
Figure 11.
β values from linear regressions conducted on blink latency versus reaction time for each subject separately (n = 16 for visual and n = 17 for auditory). Asterisks represent subjects that showed a p value above 0.05 for the regression analysis, and circles represent subjects that showed a p value below 0.05.

