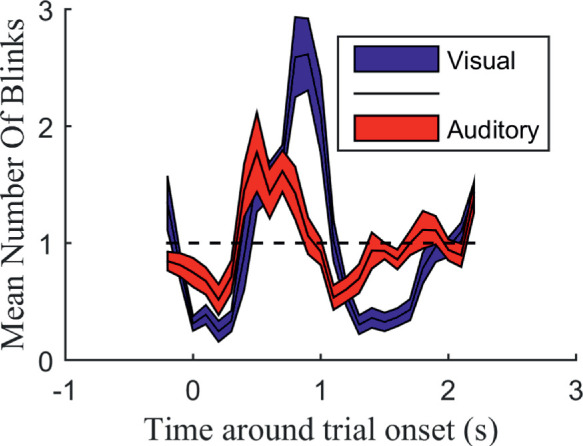
Figure 4.

Normalized mean number of blinks during the visual and the auditory condition around trial onset (i.e., onset of the first stimulus of the pair). The x-axis represents timing with 0.1-second non-overlapping windows. The y-axis represents the normalized mean number of blinks in each window over all subjects. The normalized mean was calculated by first taking the mean number of blinks in each 0.1-second bin and dividing that by the mean number of blinks in all bins for each subject and finally taking the mean for each bin over all subjects. Therefore, a value of 1 would be the baseline number of blinks. The colored regions represent the standard error.
