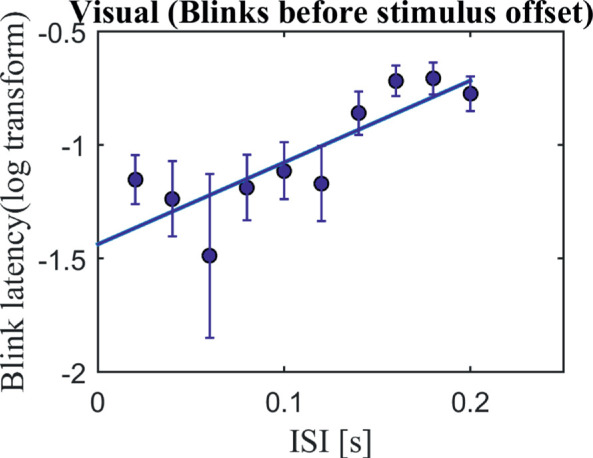
Figure 7.

The effect of ISI (task-relevant input) on blinks occurring before the offset. Blink latency is plotted against the ISI in the visual condition (n = 16). The x-axis shows the ISIs, and the y-axis shows the log-transformed blink latency (onset of first blink after trial onset but only if this blink occurred before stimulus offset). Error bars represent standard errors. A linear regression model showed a significant effect, F(1, 125) = 12.1, r2 = 0.2, p = 0.0005. Supplementary Figure S3 shows individual data.
