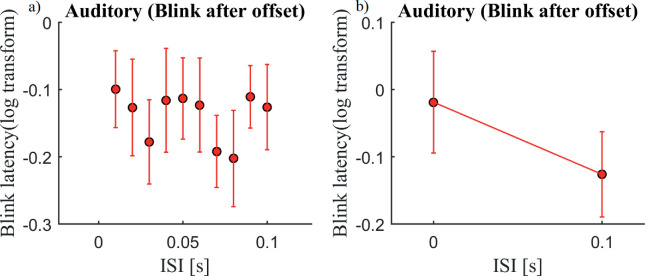
Figure 9.
Blink latency plotted against the ISIs (a) and for the 0 and 0.1-second ISIs (b) in the auditory condition (n = 10; one subject had no blinks after stimulus offset for ISI = 0). Only those blinks that occurred after stimulus offset were included. The x-axis shows the ISIs, and the y-axis shows the log-transformed blink latency (onset of first blink after trial onset but only if this blink occurred after stimulus offset). Error bars represent standard errors. A two-factor ANCOVA (excluding ISI = 0) revealed no significant effect of ISI, F(1, 305) = 0.9, p = 0.3. A t-test between the 0-second and the 0.1-second ISIs revealed a p value of 0.05, t(9) = 2.2. Supplementary Figure S5 shows individual data.

