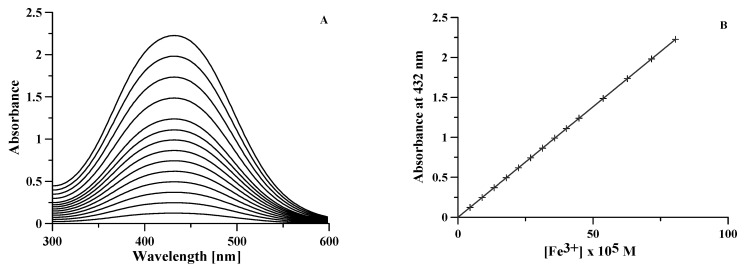
Figure 5.
(A) Spectra of 14 Fe3+-DFO solutions with [DFO] = 1.6 × 10⁻³ M and [Fe3+] ranging from 4.5 × 10⁻⁵ M to 8 × 10⁻⁴ M. (B) Calibration plot of the absorbance at 432 nm vs. iron concentration for each of the 14 solutions; regression line calculated for a straight line through the origin is reported as a continuous line.

