Figure 2.
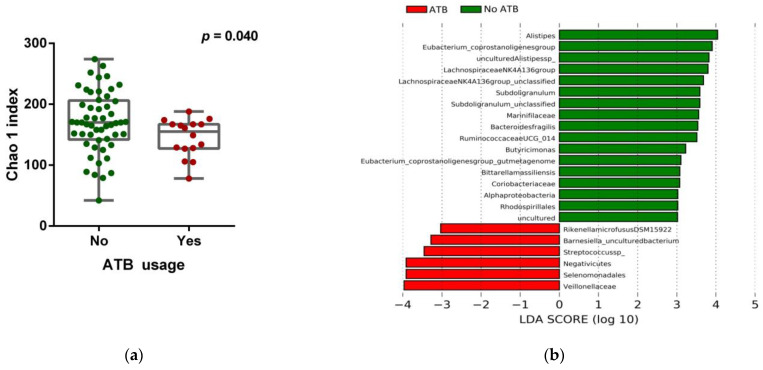
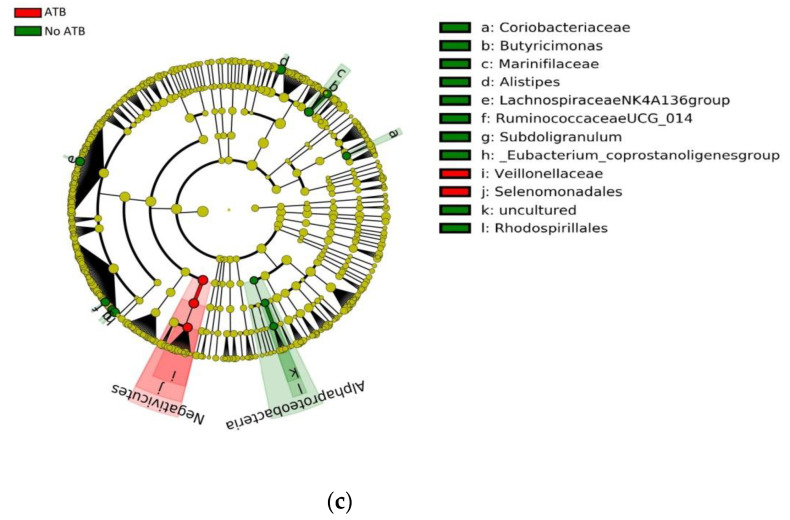
Gut microbiota composition and ATB usage. (a) Chao 1 index score of the gut microbiota in patients stratified according to ATB usage, by the Mann–Whitney U rank sum test. Error bars represent the distribution of alpha-diversity scores. (b) Multi-level differential abundance analysis using linear discriminant analysis (LDA) effect size (LEfSe) of patients stratified according to ATB usage. (c) Taxonomic cladogram from the LEfSe analysis showing differences in fecal taxa in ATB and non-ATB groups. Dot size is proportional to the abundance of the taxon. Green legends represent patients who did not receive ATB treatment, and red legends the patients who were prescribed ATB within 3 months before ICB treatment. ATB: antibiotics. LDA score > 3.0; p < 0.05.


