
Figure 3.
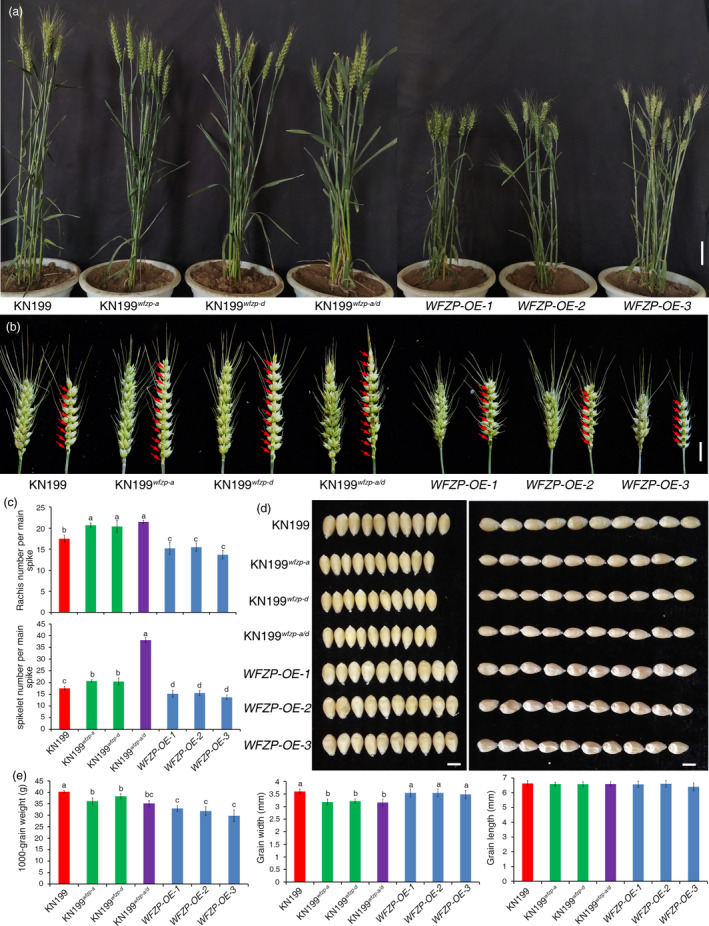
Phenotypic characterization of KN199, KN199 wfzp‐a , KN199 wfzp‐d , KN199 wfzp‐a/d and WFZP OE lines. (a) Representative plants of KN199, wfzp mutant and WFZP OE lines. (b) Spikes of KN199, wfzp mutant and WFZP OE lines. Red arrows show the rachis node. (c) Statistics comparison of rachis node number per main spike and spikelet number per main spike between KN199, wfzp mutant and WFZP OE lines. The error bars denote ± SE. Different letters mean significant difference at P < 0.01. (d) The comparison of grain width and grain length between KN199, wfzp mutant and WFZP OE lines. (e) Statistics comparison of 1000‐grain weight, grain width and grain length between KN199, wfzp mutant and WFZP OE lines. The error bars denote ± SE. Different letters mean significant difference at P < 0.01. Bars = 5cm in a, 2 cm in b and 0.5 cm in d.